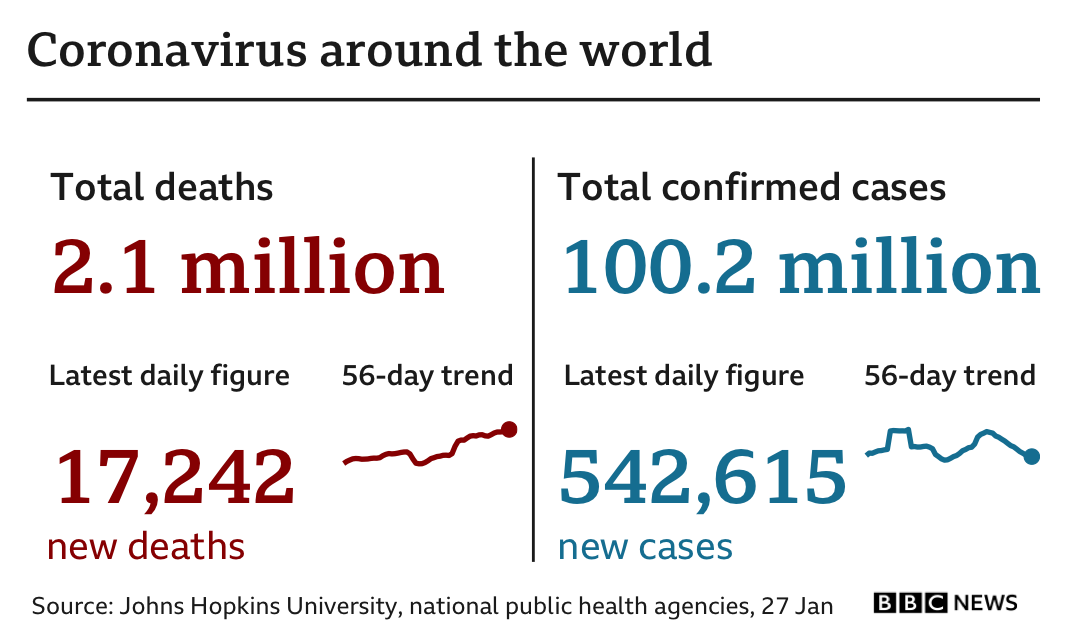
Coronavirus is still spreading around the world, with over 100 million confirmed cases and more than two million deaths across nearly 200 countries.

The countries with the highest number of confirmed cases are the US, India and Brazil and they are closely followed by a number of European countries.
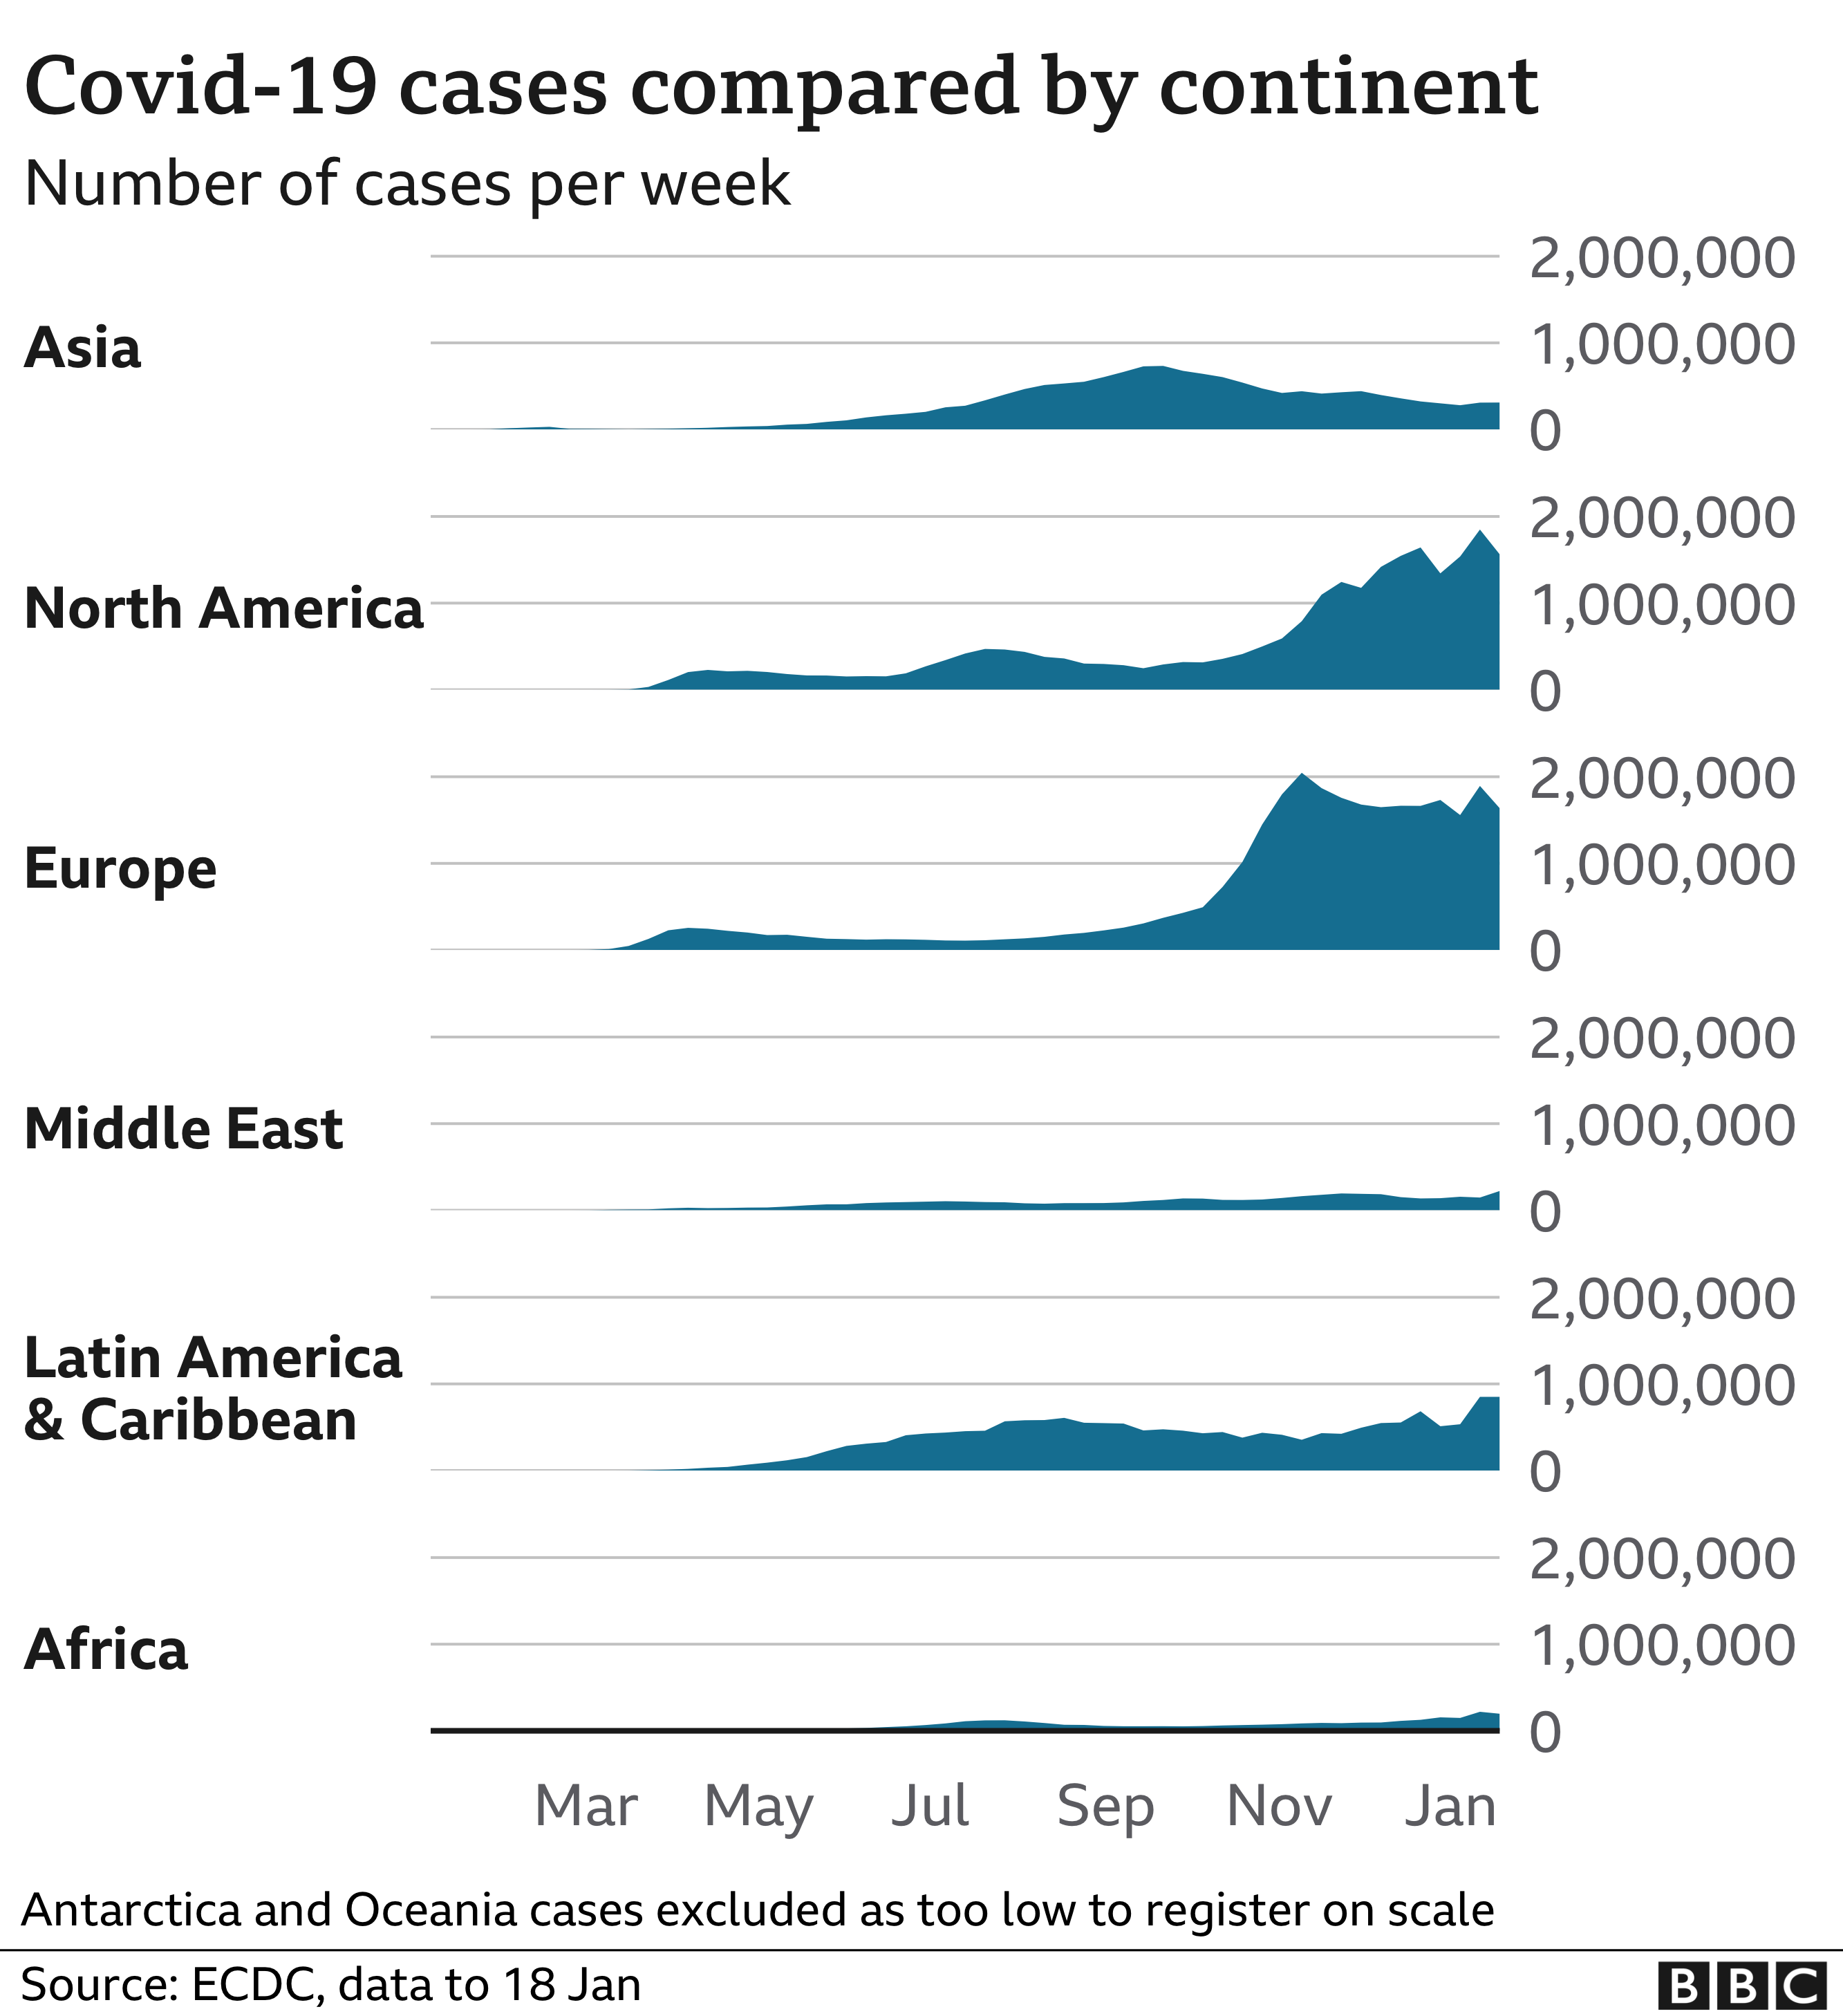
But the virus has surged across the world and very few places have managed to avoid it.
mapped
 mapped
The world
Africa
North America
Latin America & Caribbean
Asia
Europe
Middle East
Oceania
Source: Johns Hopkins University, national public health agencies
Figures last updated 27 January 2021, 08:33 GMT

In the table below, countries can be reordered by deaths, death rate and total cases. In the coloured bars on the right-hand side, countries in which cases have risen to more than 10,000 per day are those with black bars on the relevant date.
data in detail
*Deaths per 100,000 people
The world
Africa
North America
Latin America & Caribbean
Asia
Europe
Middle East
Oceania
|
New Cases
|
||||
|---|---|---|---|---|
| US | 423,280 | 129.4 | 25,337,565 | |
| Brazil | 218,878 | 104.5 | 8,933,356 | |
| India | 153,724 | 11.4 | 10,689,527 | |
| Mexico | 152,016 | 120.5 | 1,788,905 | |
| UK | 100,162 | 149.2 | 3,689,746 | |
| Italy | 86,422 | 142.5 | 2,485,956 | |
| France | 74,106 | 114.0 | 3,079,943 | |
| Russia | 69,391 | 47.6 | 3,716,228 | |
| Iran | 57,560 | 70.4 | 1,385,706 | |
| Spain | 56,794 | 121.6 | 2,629,817 | |
| Germany | 53,619 | 64.5 | 2,164,043 | |
| Colombia | 52,128 | 105.0 | 2,041,352 | |
| Argentina | 47,253 | 106.5 | 1,885,210 | |
| South Africa | 41,797 | 72.3 | 1,423,578 | |
| Peru | 40,107 | 125.4 | 1,107,239 | |
| Poland | 35,665 | 94.0 | 1,482,722 | |
| Indonesia | 28,468 | 10.6 | 1,012,350 | |
| Turkey | 25,344 | 30.8 | 2,442,350 | |
| Ukraine | 23,293 | 52.6 | 1,241,586 | |
| Belgium | 20,879 | 181.8 | 696,642 | |
| Canada | 18,981 | 51.2 | 761,697 | |
| Chile | 18,023 | 96.2 | 706,500 | |
| Romania | 17,938 | 92.0 | 715,438 | |
| Czech Republic | 15,791 | 148.1 | 956,155 | |
| Ecuador | 14,668 | 85.9 | 242,146 | |
| Netherlands | 13,668 | 80.1 | 957,063 | |
| Iraq | 13,010 | 33.9 | 615,380 | |
| Hungary | 12,113 | 124.8 | 360,877 | |
| Pakistan | 11,450 | 5.4 | 537,477 | |
| Sweden | 11,247 | 112.8 | 556,289 | |
| Portugal | 11,012 | 107.4 | 653,878 | |
| Philippines | 10,386 | 9.7 | 516,166 | |
| Bolivia | 10,105 | 89.0 | 205,208 | |
| Switzerland | 9,204 | 108.0 | 515,483 | |
| Egypt | 9,067 | 9.2 | 163,129 | |
| Bulgaria | 8,916 | 126.4 | 216,416 | |
| Morocco | 8,187 | 22.7 | 467,493 | |
| Bangladesh | 8,055 | 5.0 | 532,916 | |
| Austria | 7,515 | 84.5 | 407,140 | |
| Tunisia | 6,370 | 55.1 | 200,662 | |
| Saudi Arabia | 6,359 | 18.9 | 366,807 | |
| Greece | 5,692 | 54.1 | 153,226 | |
| Guatemala | 5,486 | 31.8 | 155,459 | |
| Japan | 5,301 | 4.2 | 373,868 | |
| Panama | 5,137 | 123.0 | 313,834 | |
| Croatia | 4,882 | 117.5 | 229,502 | |
| China | 4,809 | 0.3 | 99,541 | |
| Bosnia and Herzegovina | 4,621 | 139.0 | 120,532 | |
| Israel | 4,513 | 53.8 | 617,168 | |
| Slovakia | 4,260 | 78.1 | 238,617 | |
| Jordan | 4,248 | 42.6 | 322,241 | |
| Serbia | 3,924 | 56.2 | 387,206 | |
| Honduras | 3,486 | 36.4 | 142,880 | |
| Slovenia | 3,406 | 163.9 | 159,812 | |
| Moldova | 3,381 | 83.4 | 156,972 | |
| Georgia | 3,108 | 77.6 | 255,564 | |
| Azerbaijan | 3,100 | 31.2 | 229,358 | |
| Myanmar | 3,082 | 5.7 | 138,368 | |
| Ireland | 3,066 | 63.6 | 189,851 | |
| Armenia | 3,056 | 103.5 | 166,427 | |
| Kazakhstan | 3,035 | 16.6 | 228,692 | |
| Algeria | 2,871 | 6.8 | 106,097 | |
| North Macedonia | 2,812 | 135.0 | 91,161 | |
| Lithuania | 2,688 | 96.0 | 177,934 | |
| Paraguay | 2,651 | 38.1 | 129,394 | |
| Costa Rica | 2,567 | 51.3 | 191,345 | |
| Dominican Republic | 2,564 | 24.1 | 206,305 | |
| Lebanon | 2,477 | 36.1 | 285,754 | |
| Afghanistan | 2,389 | 6.4 | 54,750 | |
| Ethiopia | 2,075 | 1.9 | 134,569 | |
| Denmark | 2,030 | 35.3 | 195,948 | |
| Nepal | 2,017 | 7.2 | 270,092 | |
| Palestinian Territories | 1,803 | 37.1 | 156,393 | |
| Libya | 1,789 | 26.8 | 115,299 | |
| Kenya | 1,750 | 3.4 | 100,193 | |
| Sudan | 1,750 | 4.2 | 28,522 | |
| Belarus | 1,668 | 17.6 | 239,482 | |
| El Salvador | 1,589 | 24.7 | 53,479 | |
| Oman | 1,524 | 31.6 | 133,407 | |
| Nigeria | 1,522 | 0.8 | 124,299 | |
| Kosovo | 1,466 | 79.4 | 58,399 | |
| Kyrgyzstan | 1,405 | 22.3 | 84,175 | |
| South Korea | 1,378 | 2.7 | 76,429 | |
| Albania | 1,332 | 46.2 | 73,691 | |
| Venezuela | 1,159 | 4.0 | 124,525 | |
| Latvia | 1,126 | 58.4 | 61,924 | |
| Zimbabwe | 1,103 | 7.6 | 32,004 | |
| Kuwait | 957 | 23.1 | 162,282 | |
| Australia | 909 | 3.7 | 28,786 | |
| Syria | 895 | 5.3 | 13,762 | |
| United Arab Emirates | 805 | 8.4 | 285,147 | |
| Montenegro | 777 | 123.8 | 59,262 | |
| Malaysia | 700 | 2.2 | 190,434 | |
| Zambia | 672 | 3.9 | 47,622 | |
| DR Congo | 661 | 0.8 | 22,048 | |
| Finland | 655 | 11.9 | 43,120 | |
| Uzbekistan | 621 | 1.9 | 78,510 | |
| Yemen | 615 | 2.2 | 2,119 | |
| Senegal | 592 | 3.7 | 25,127 | |
| Luxembourg | 570 | 94.3 | 49,852 | |
| Norway | 550 | 10.3 | 61,594 | |
| Malawi | 540 | 3.0 | 20,830 | |
| Eswatini | 517 | 45.5 | 14,830 | |
| Cameroon | 462 | 1.8 | 29,617 | |
| Angola | 462 | 1.5 | 19,553 | |
| Mauritania | 418 | 9.5 | 16,460 | |
| Uruguay | 401 | 11.6 | 38,680 | |
| Estonia | 392 | 29.6 | 41,330 | |
| Ghana | 372 | 1.2 | 62,135 | |
| Bahrain | 370 | 23.6 | 100,689 | |
| Jamaica | 339 | 11.6 | 15,153 | |
| Mozambique | 329 | 1.1 | 34,055 | |
| Namibia | 328 | 13.4 | 32,957 | |
| Mali | 327 | 1.7 | 8,006 | |
| Uganda | 318 | 0.7 | 39,261 | |
| Belize | 293 | 76.5 | 11,788 | |
| Sri Lanka | 288 | 1.4 | 59,922 | |
| Madagascar | 279 | 1.1 | 18,743 | |
| Malta | 255 | 58.1 | 16,999 | |
| Qatar | 248 | 8.9 | 149,595 | |
| Haiti | 243 | 2.2 | 11,286 | |
| Cuba | 200 | 1.8 | 22,614 | |
| Cyprus | 190 | 16.0 | 30,252 | |
| Rwanda | 181 | 1.5 | 13,885 | |
| Bahamas | 175 | 45.4 | 8,140 | |
| Guyana | 172 | 22.1 | 7,346 | |
| Nicaragua | 169 | 2.6 | 6,253 | |
| Guadeloupe | 157 | 39.3 | 9,056 | |
| Niger | 153 | 0.7 | 4,407 | |
| Suriname | 150 | 26.0 | 8,174 | |
| Ivory Coast | 147 | 0.6 | 27,237 | |
| Lesotho | 146 | 6.9 | 8,047 | |
| Trinidad and Tobago | 134 | 9.6 | 7,496 | |
| French Polynesia | 131 | 47.2 | 17,961 | |
| Somalia | 130 | 0.9 | 4,754 | |
| Cape Verde | 129 | 23.7 | 13,619 | |
| Gambia | 128 | 5.6 | 4,012 | |
| Botswana | 124 | 5.5 | 20,658 | |
| Burkina Faso | 118 | 0.6 | 10,157 | |
| Congo | 117 | 2.2 | 7,887 | |
| Chad | 116 | 0.7 | 3,225 | |
| Andorra | 97 | 126.0 | 9,638 | |
| Tajikistan | 90 | 1.0 | 13,308 | |
| Equatorial Guinea | 86 | 6.6 | 5,454 | |
| Liberia | 84 | 1.7 | 1,932 | |
| Guinea | 82 | 0.7 | 14,379 | |
| Channel Islands | 79 | 46.3 | 3,499 | |
| Sierra Leone | 77 | 1.0 | 3,194 | |
| Comoros | 77 | 9.3 | 2,425 | |
| French Guiana | 76 | 26.9 | 15,702 | |
| Thailand | 76 | 0.1 | 15,465 | |
| Togo | 76 | 1.0 | 4,682 | |
| Gibraltar | 69 | 204.7 | 4,024 | |
| Gabon | 67 | 3.2 | 10,411 | |
| San Marino | 65 | 192.4 | 2,915 | |
| South Sudan | 64 | 0.6 | 3,788 | |
| Central African Republic | 63 | 1.4 | 4,980 | |
| Djibouti | 62 | 6.5 | 5,923 | |
| Mayotte | 59 | 22.7 | 7,590 | |
| Aruba | 57 | 53.9 | 6,768 | |
| Liechtenstein | 52 | 137.1 | 2,455 | |
| Maldives | 51 | 9.9 | 15,247 | |
| Benin | 48 | 0.4 | 3,643 | |
| Réunion | 45 | 5.1 | 9,843 | |
| Guinea-Bissau | 45 | 2.4 | 2,532 | |
| Martinique | 44 | 11.7 | 6,370 | |
| Vietnam | 35 | 0.0 | 1,551 | |
| Singapore | 29 | 0.5 | 59,366 | |
| Iceland | 29 | 8.6 | 5,992 | |
| Saint Martin | 27 | 72.5 | 1,767 | |
| New Zealand | 25 | 0.5 | 2,295 | |
| Isle of Man | 25 | 29.7 | 432 | |
| Tanzania | 21 | 0.0 | 509 | |
| Curaçao | 20 | 12.3 | 4,558 | |
| Sao Tome and Principe | 17 | 8.1 | 1,210 | |
| Saint Lucia | 13 | 7.1 | 921 | |
| Diamond Princess cruise ship | 13 | 712 | ||
| Bermuda | 12 | 19.1 | 688 | |
| Barbados | 10 | 3.5 | 1,401 | |
| Mauritius | 10 | 0.8 | 568 | |
| Monaco | 9 | 23.3 | 1,399 | |
| Papua New Guinea | 9 | 0.1 | 850 | |
| Turks and Caicos Islands | 8 | 21.2 | 1,312 | |
| Eritrea | 7 | 0.2 | 1,970 | |
| Taiwan | 7 | 0.0 | 890 | |
| Antigua and Barbuda | 6 | 6.2 | 201 | |
| Seychelles | 3 | 3.1 | 1,116 | |
| Brunei | 3 | 0.7 | 176 | |
| Mongolia | 2 | 0.1 | 1,667 | |
| Burundi | 2 | 0.0 | 1,481 | |
| St Vincent and the Grenadines | 2 | 1.8 | 746 | |
| Cayman Islands | 2 | 3.1 | 383 | |
| Fiji | 2 | 0.2 | 55 | |
| MS Zaandam cruise ship | 2 | 9 | ||
| Bhutan | 1 | 0.1 | 856 | |
| Faroe Islands | 1 | 2.1 | 654 | |
| Saint Barthelemy | 1 | 10.2 | 300 | |
| Grenada | 1 | 0.9 | 148 | |
| British Virgin Islands | 1 | 3.4 | 114 | |
| Montserrat | 1 | 20.0 | 13 | |
| Cambodia | 0 | 0.0 | 460 | |
| Dominica | 0 | 0.0 | 113 | |
| Timor-Leste | 0 | 0.0 | 67 | |
| New Caledonia | 0 | 0.0 | 44 | |
| Laos | 0 | 0.0 | 44 | |
| Falkland Islands | 0 | 0.0 | 41 | |
| Saint Kitts and Nevis | 0 | 0.0 | 37 | |
| Greenland | 0 | 0.0 | 30 | |
| Vatican | 0 | 0.0 | 27 | |
| Saint Pierre and Miquelon | 0 | 0.0 | 23 | |
| Solomon Islands | 0 | 0.0 | 17 | |
| Anguilla | 0 | 0.0 | 16 | |
| Marshall Islands | 0 | 0.0 | 4 | |
| Samoa | 0 | 0.0 | 2 | |
| Vanuatu | 0 | 0.0 | 1 | |
| Micronesia | 0 | 0.0 | 1 |
This information is regularly updated but may not reflect the latest totals for each country.
** The past data for new cases is a three day rolling average. Due to revisions in the number of cases, an average cannot be calculated for this date.
Source: Johns Hopkins University, national public health agencies and UN population data
Figures last updated: 27 January 2021, 08:33 GMT
Note: The map, table and animated bar chart in this page use a different source for figures for France and the UK from that used by Johns Hopkins University, which results in a slightly lower overall total. US figures do not include Puerto Rico, Guam or the US Virgin Islands.
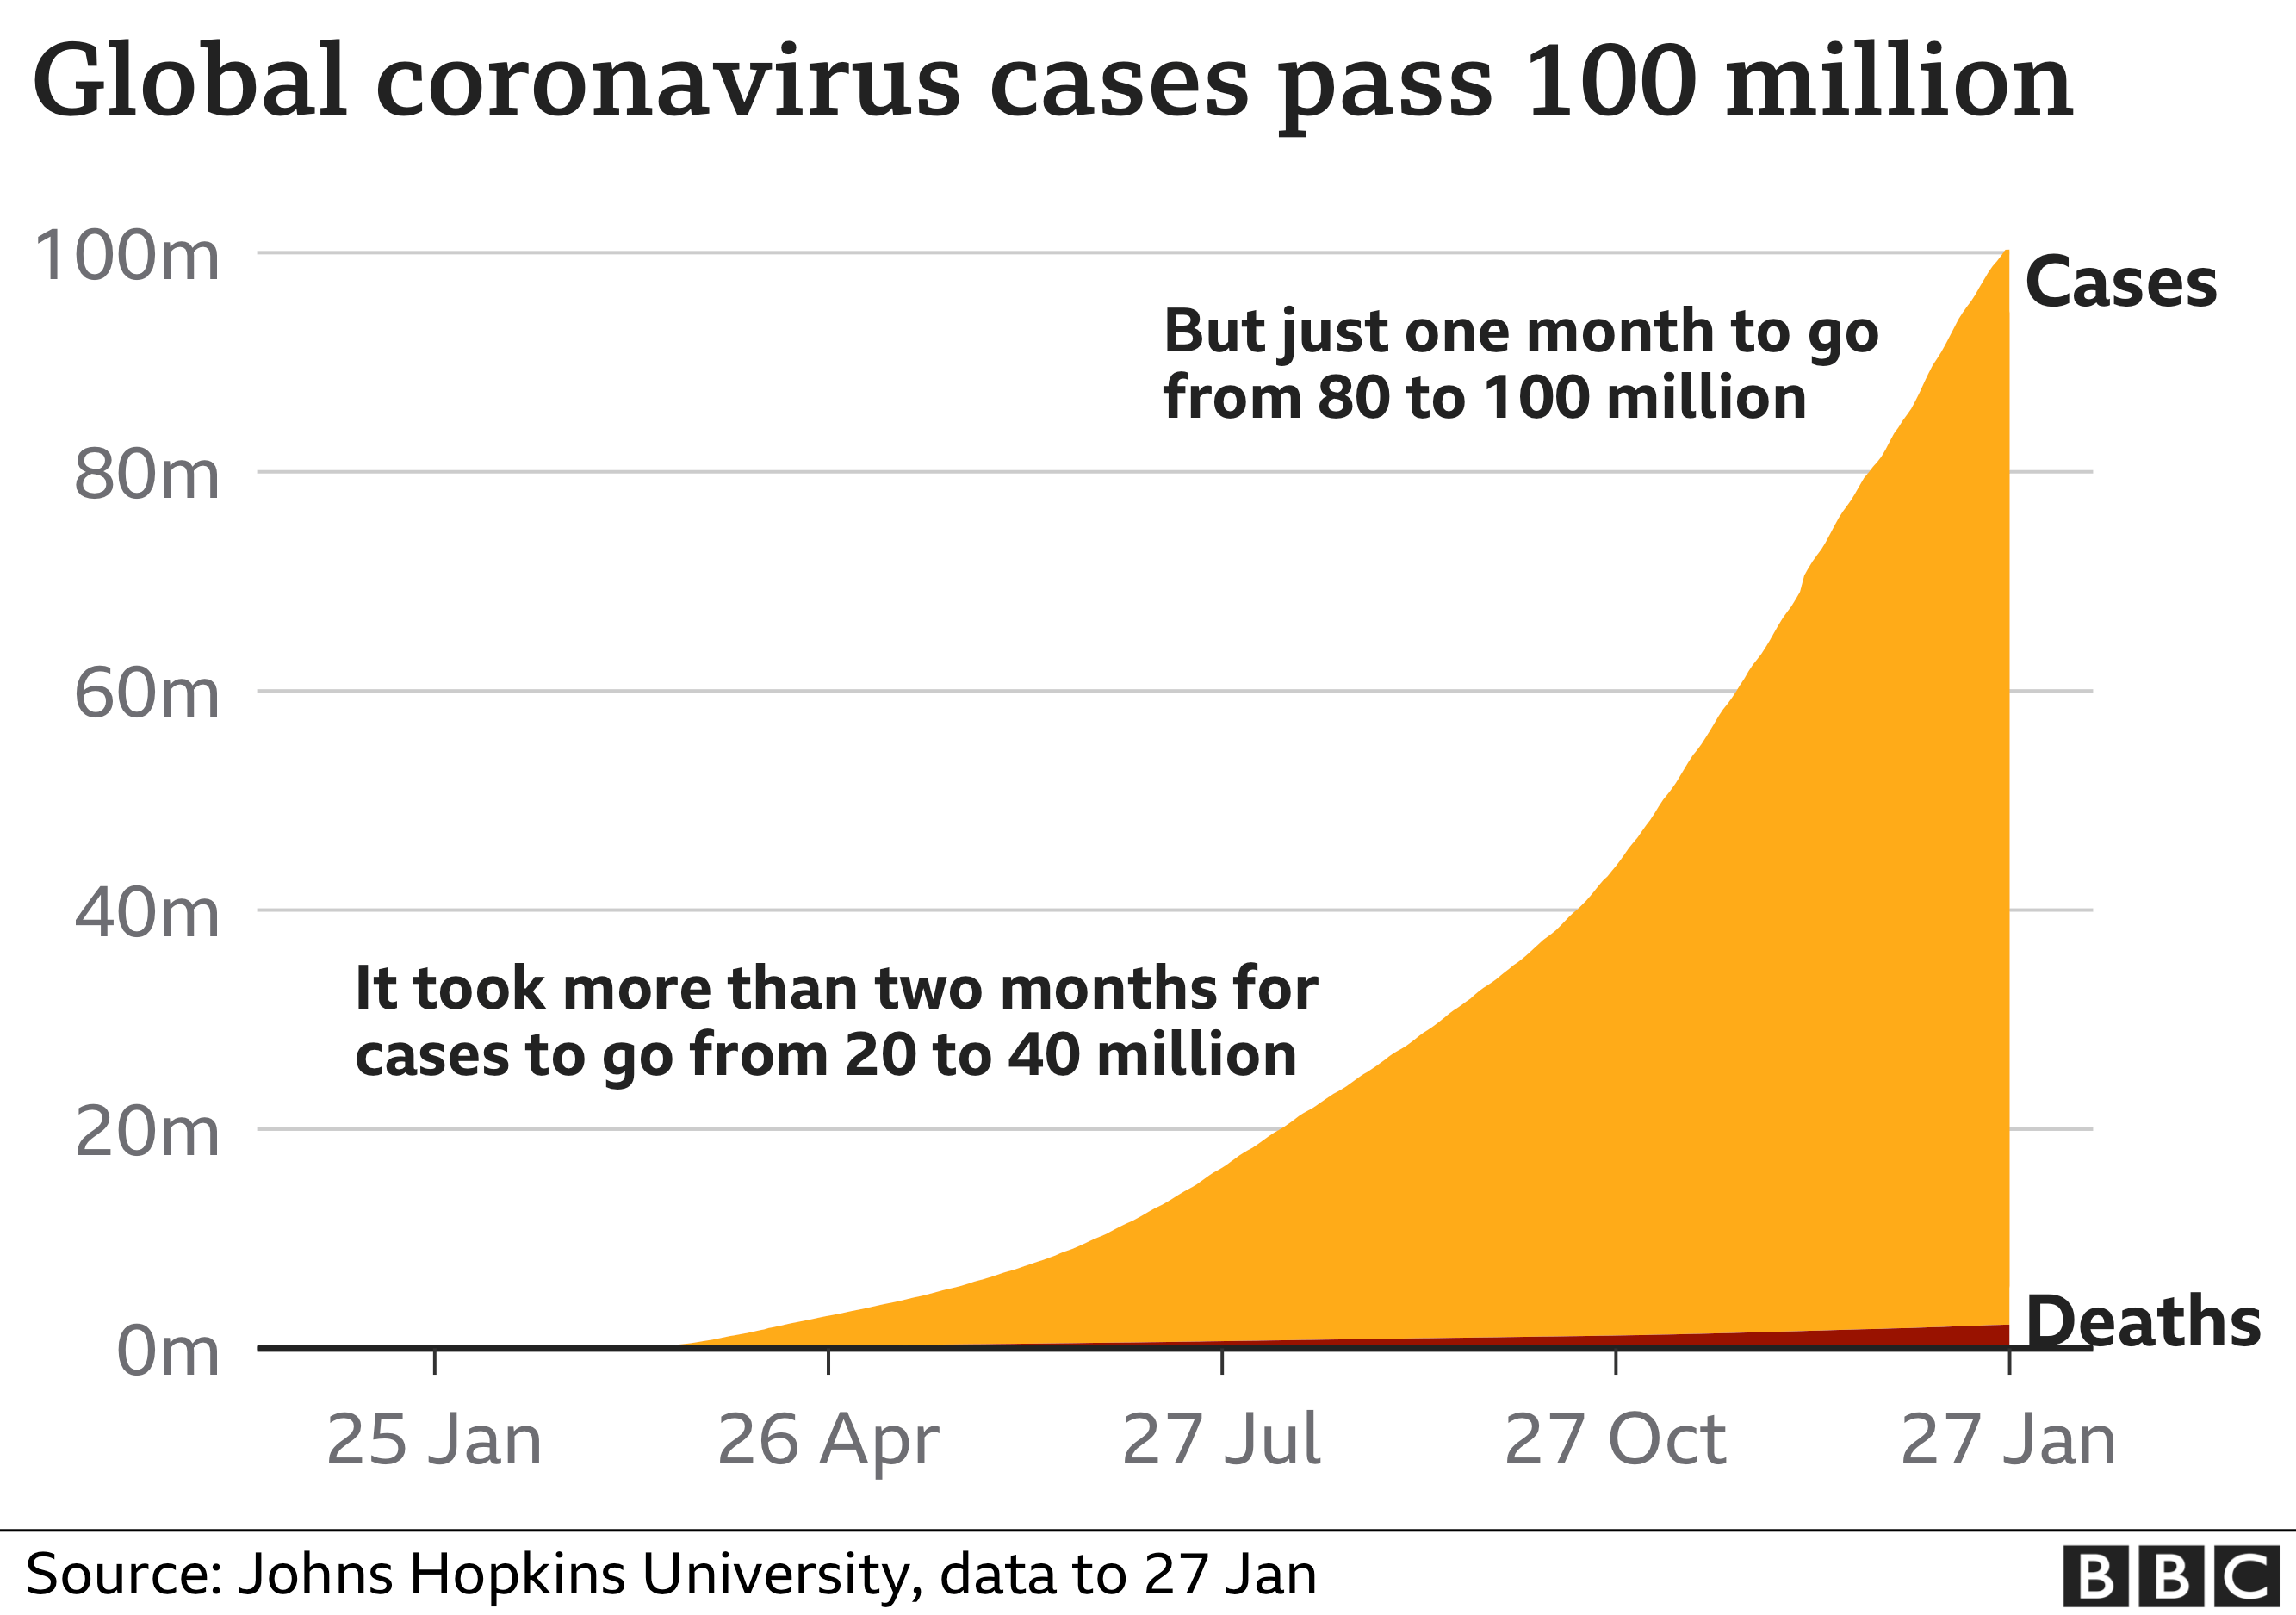
The true extent of the first outbreaks last year is unclear because limited testing meant most cases were not confirmed.
But tests are much more widely available in many countries now and the data shows a steep increase in the number of cases.
Official figures may also not fully reflect the true scale of deaths in many countries. Data on excess deaths, a measure of how many more people are dying than would be expected based on the previous few years, may give a better indication of the actual numbers in many cases.
Who has vaccinated the most?
Several coronavirus vaccines have now been approved for use, either by individual countries or groups of countries, such as the European Union and the World Health Organization (WHO).
Of the 56 countries administering vaccines and publishing rollout data, 45 are high-income nations, 11 are middle-income and just one is low-income.
Some countries have secured more vaccine doses than their populations need, while other lower-income countries are relying on a global plan known as Covax, which is seeking to ensure everyone in the world has access to a vaccine.
WHO director-general Tedros Adhanom Ghebreyesus has said that the prospects for an equitable distribution of vaccines are at “serious risk”. He added: “The world is on the brink of a catastrophic moral failure.”
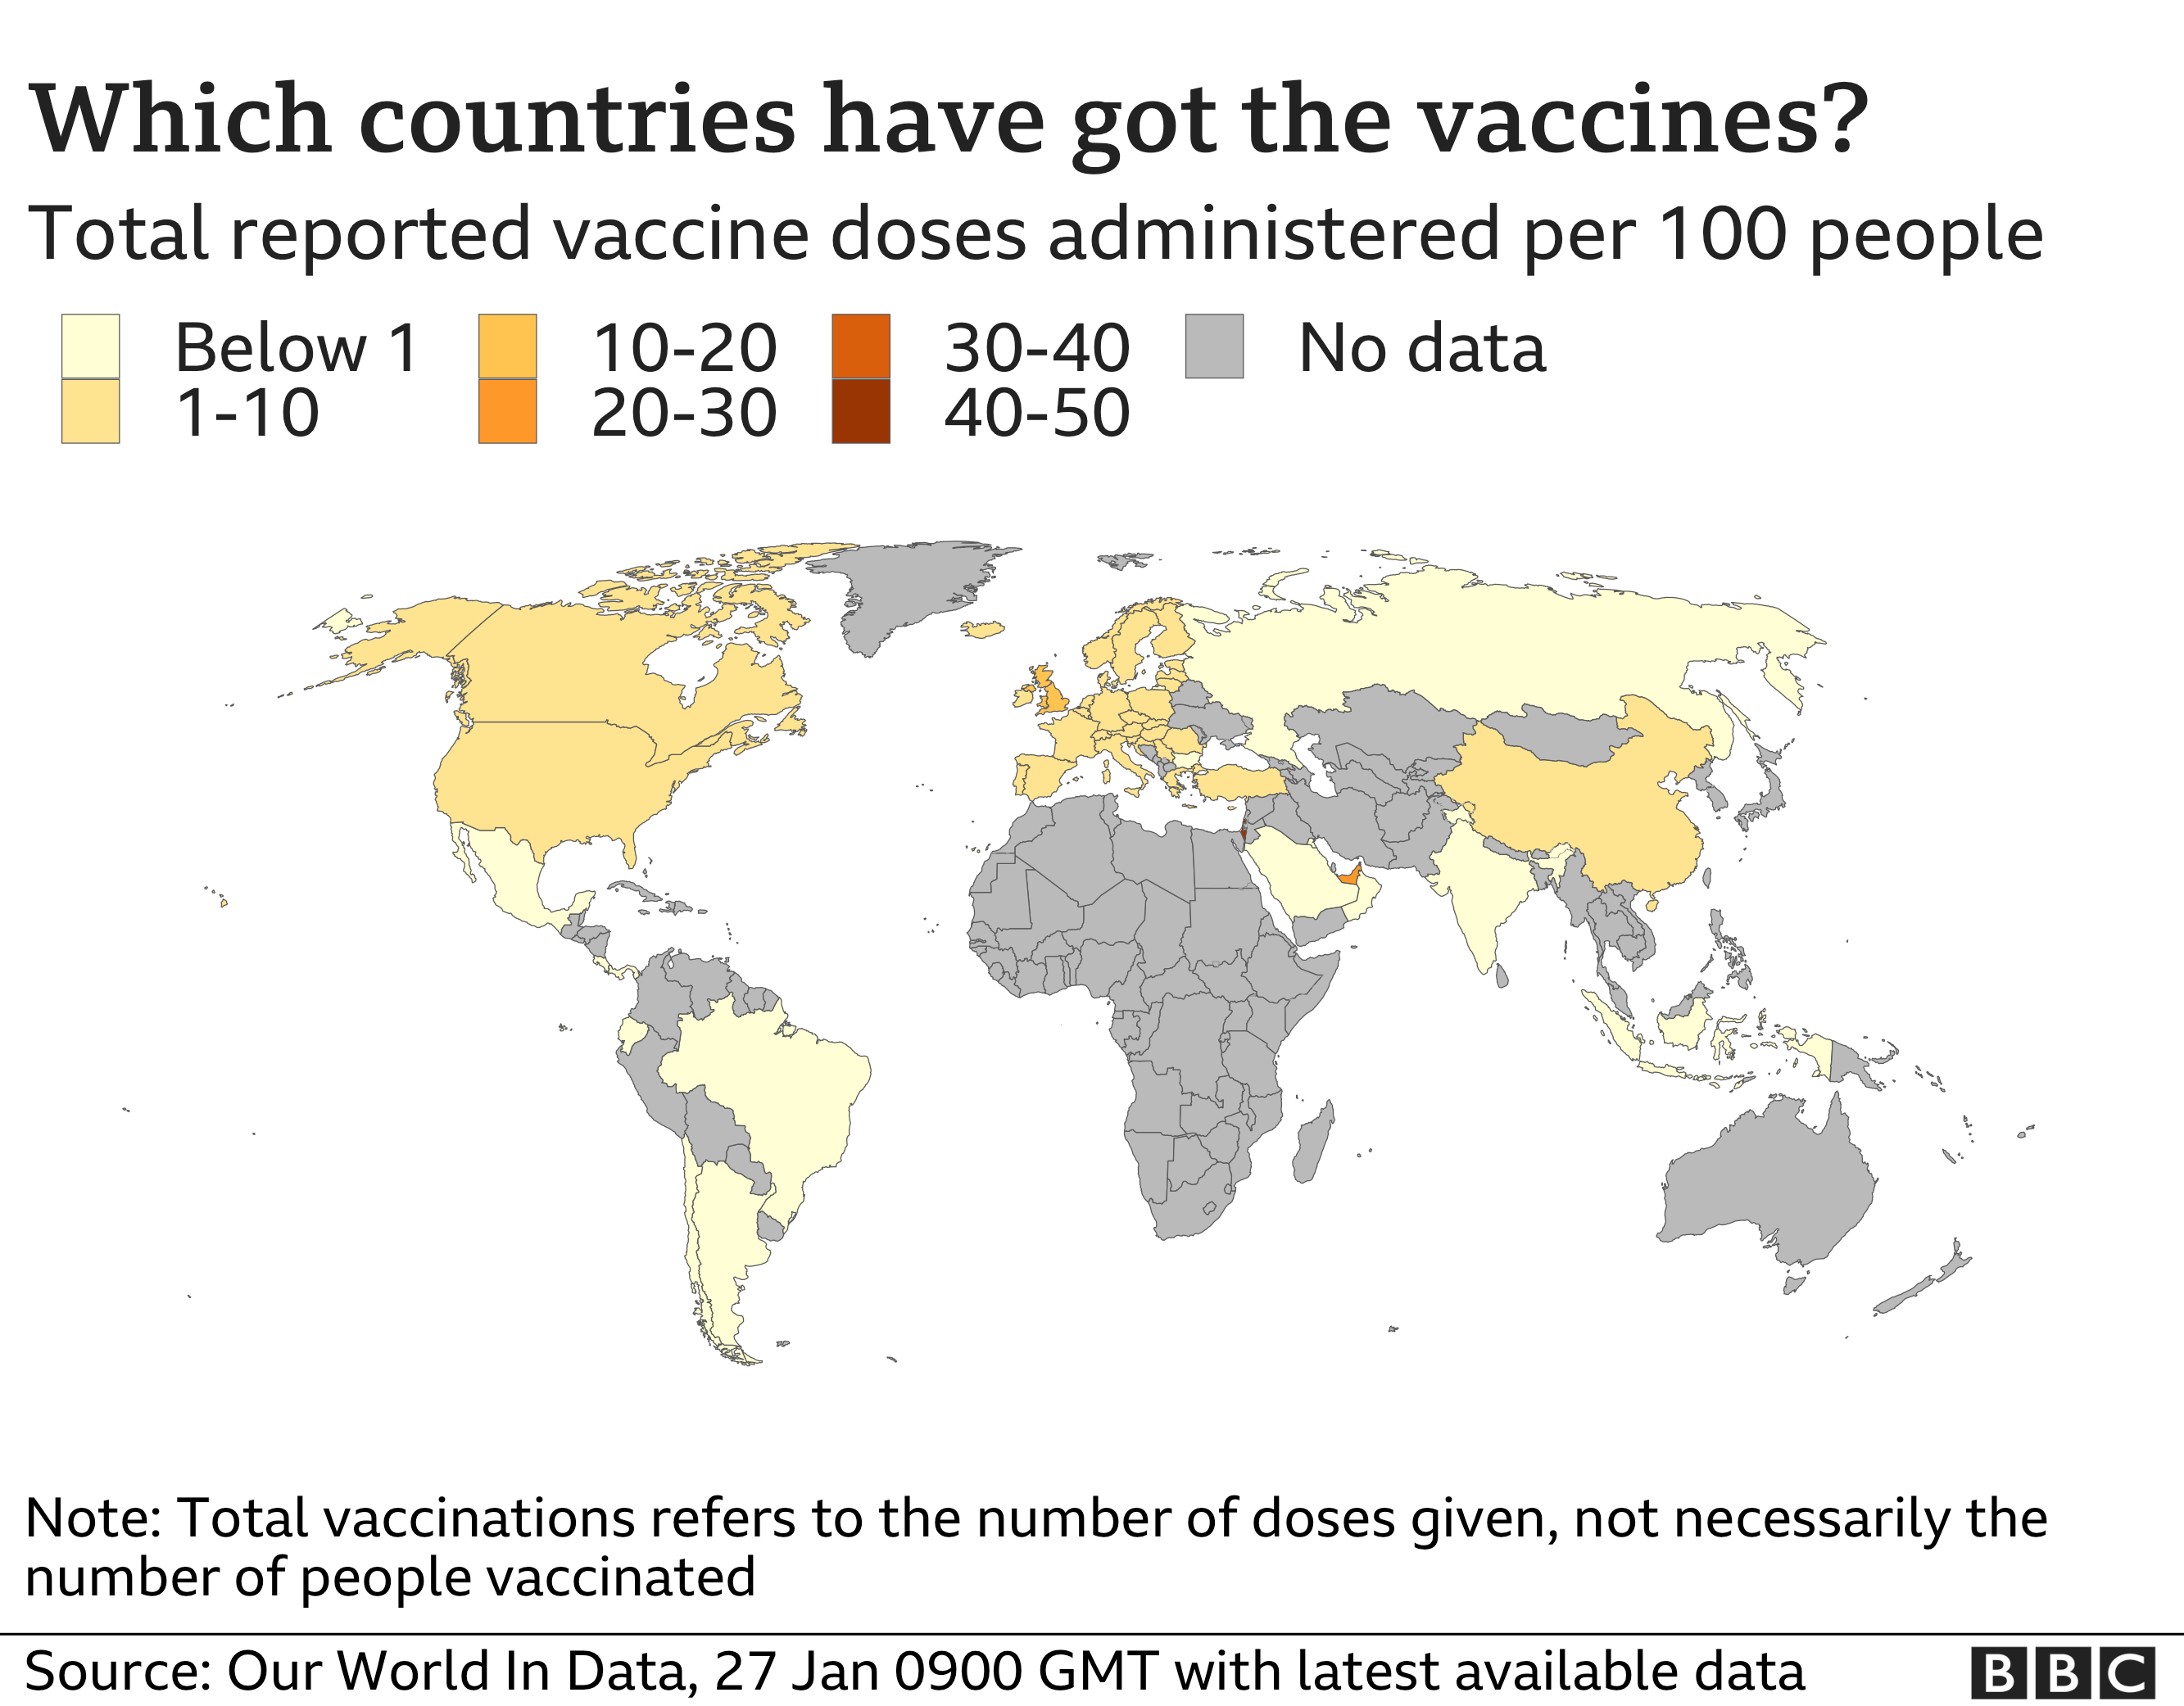
The map above, using figures collated by Our World in Data – a collaboration between Oxford University and an educational charity – shows the total number of doses given per 100 people, mostly first doses.
The US (24 million) and China (15 million) have given the most doses overall, while the UK has administered more than seven million so far.
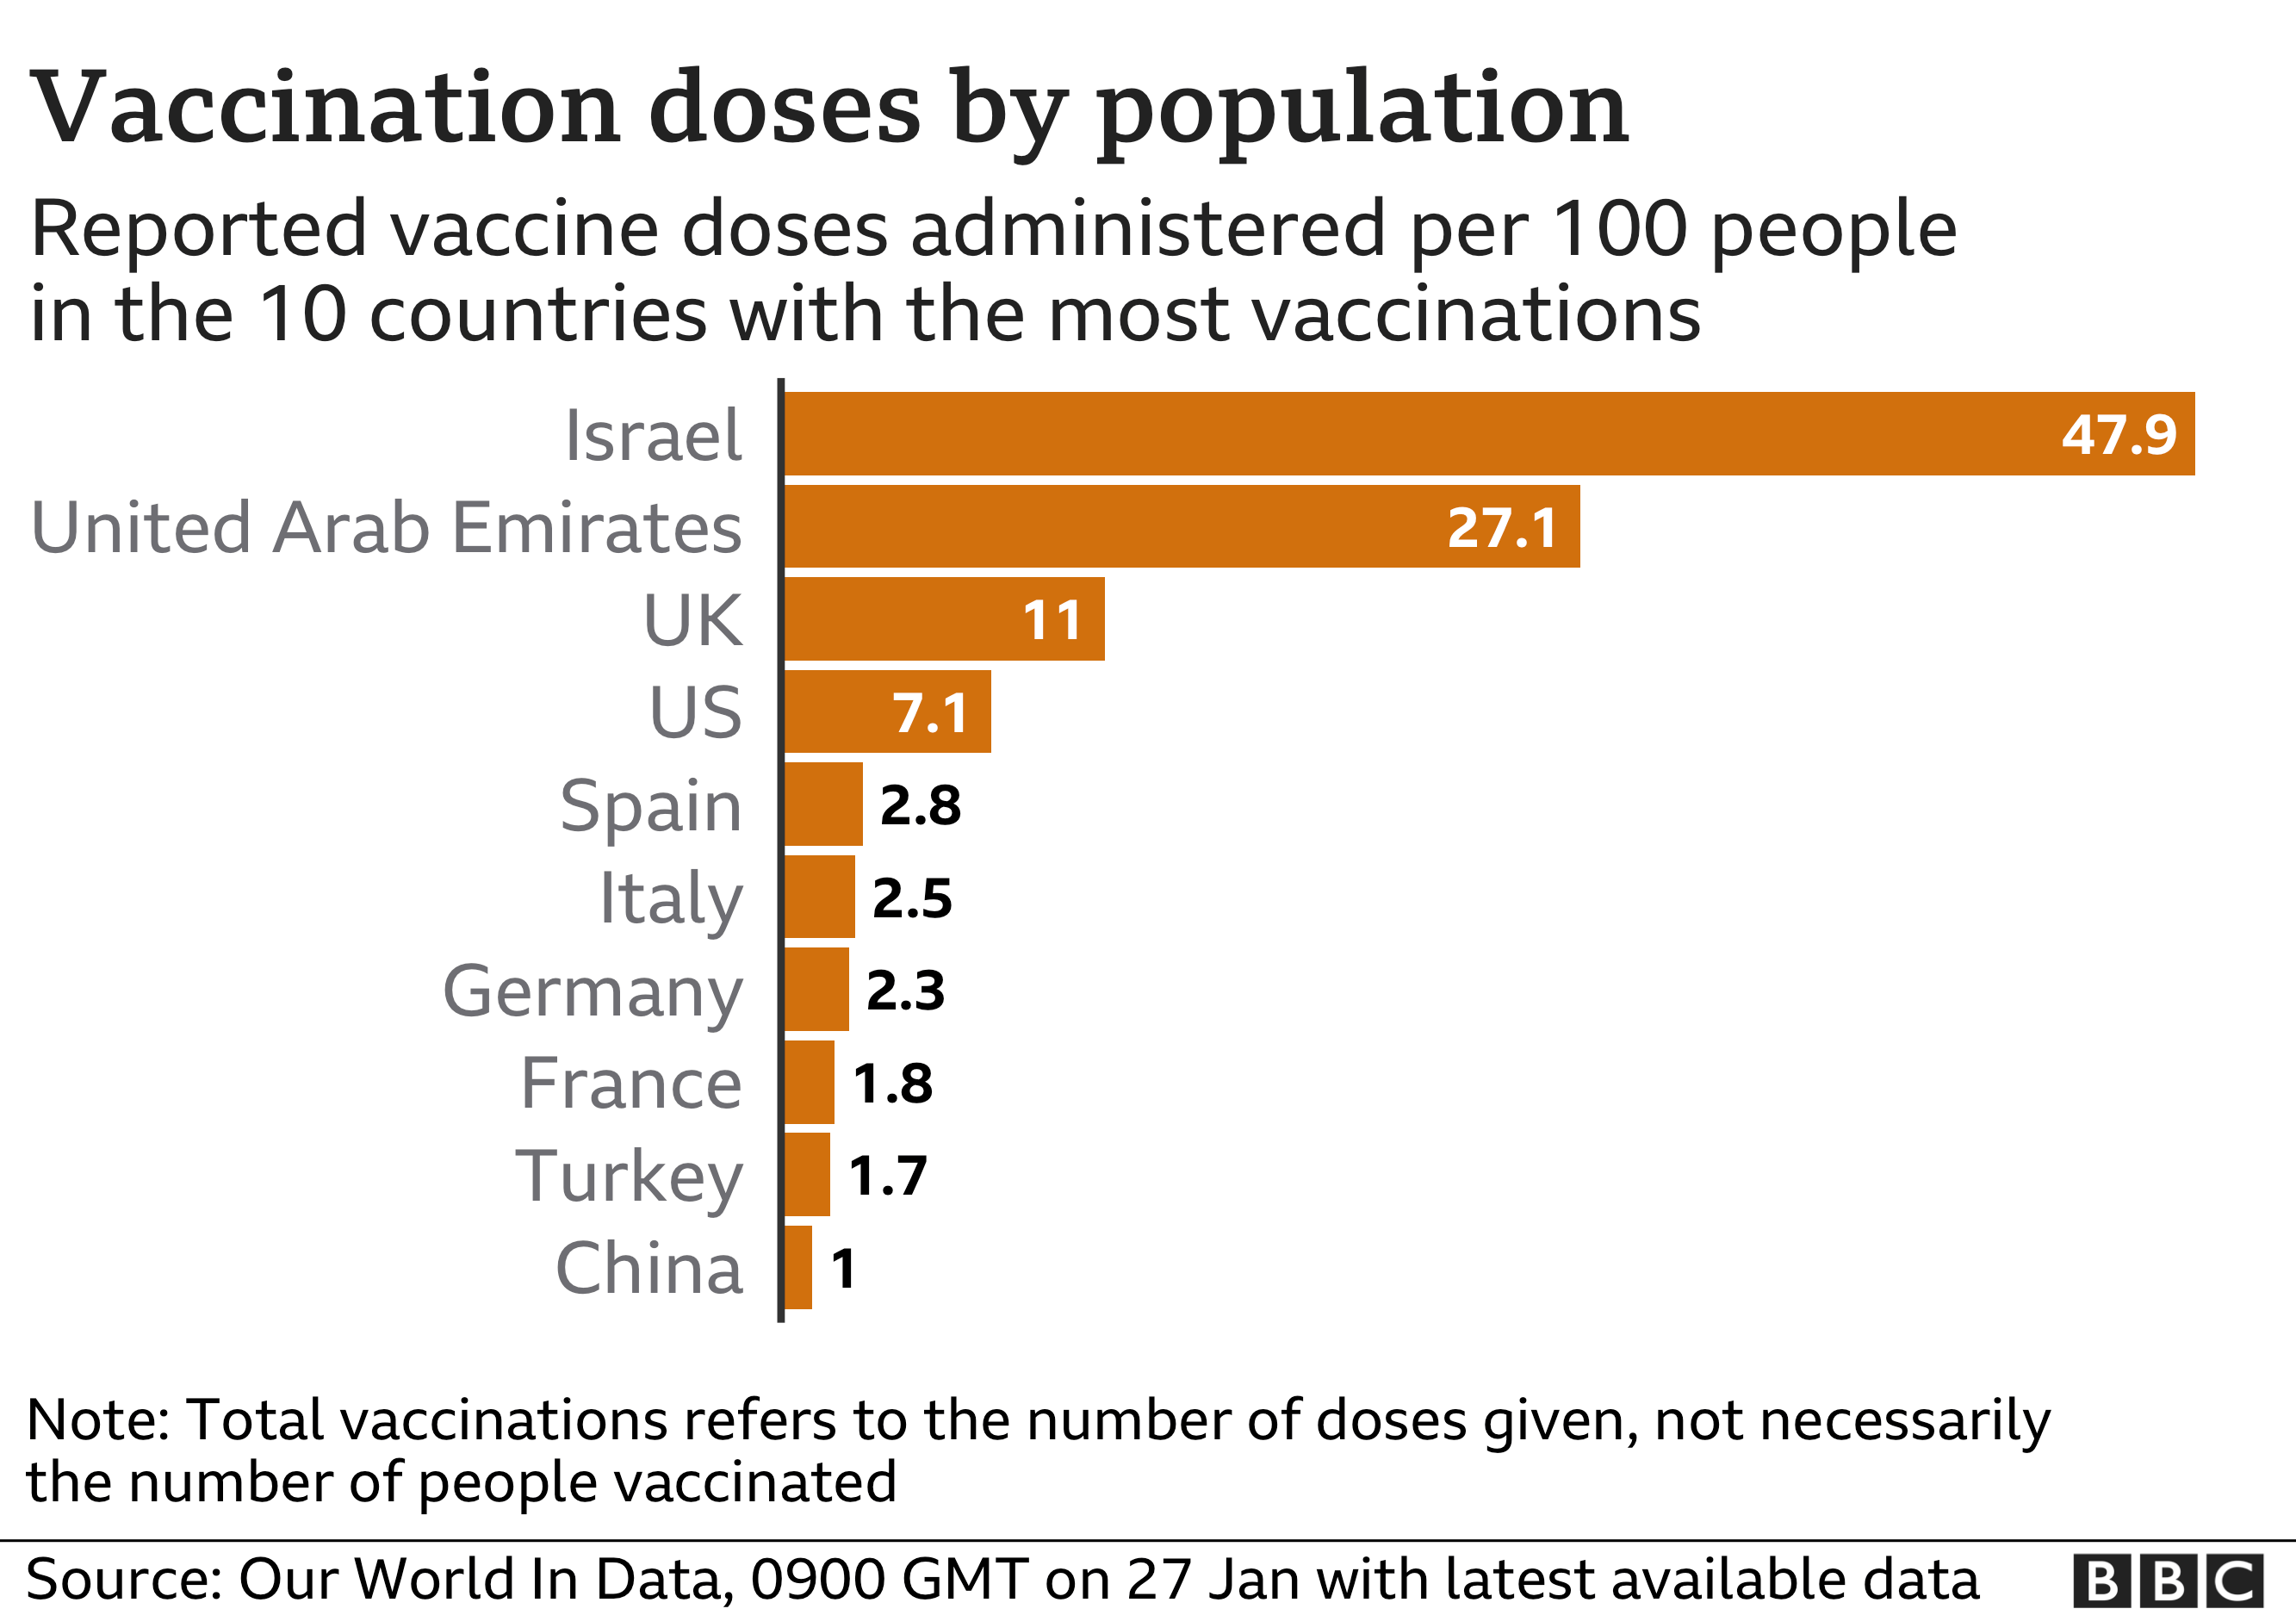
But when breaking the figures down by population, looking at doses administered per 100 people in the 10 countries giving the most vaccinations, Israel, the UAE and the UK top the list – as the chart above shows.
Most countries are prioritising the over-60s, health workers and people who are clinically vulnerable.
Where are cases still rising?
As populations await vaccine roll-out, cases remain high across a number of regions of the world.
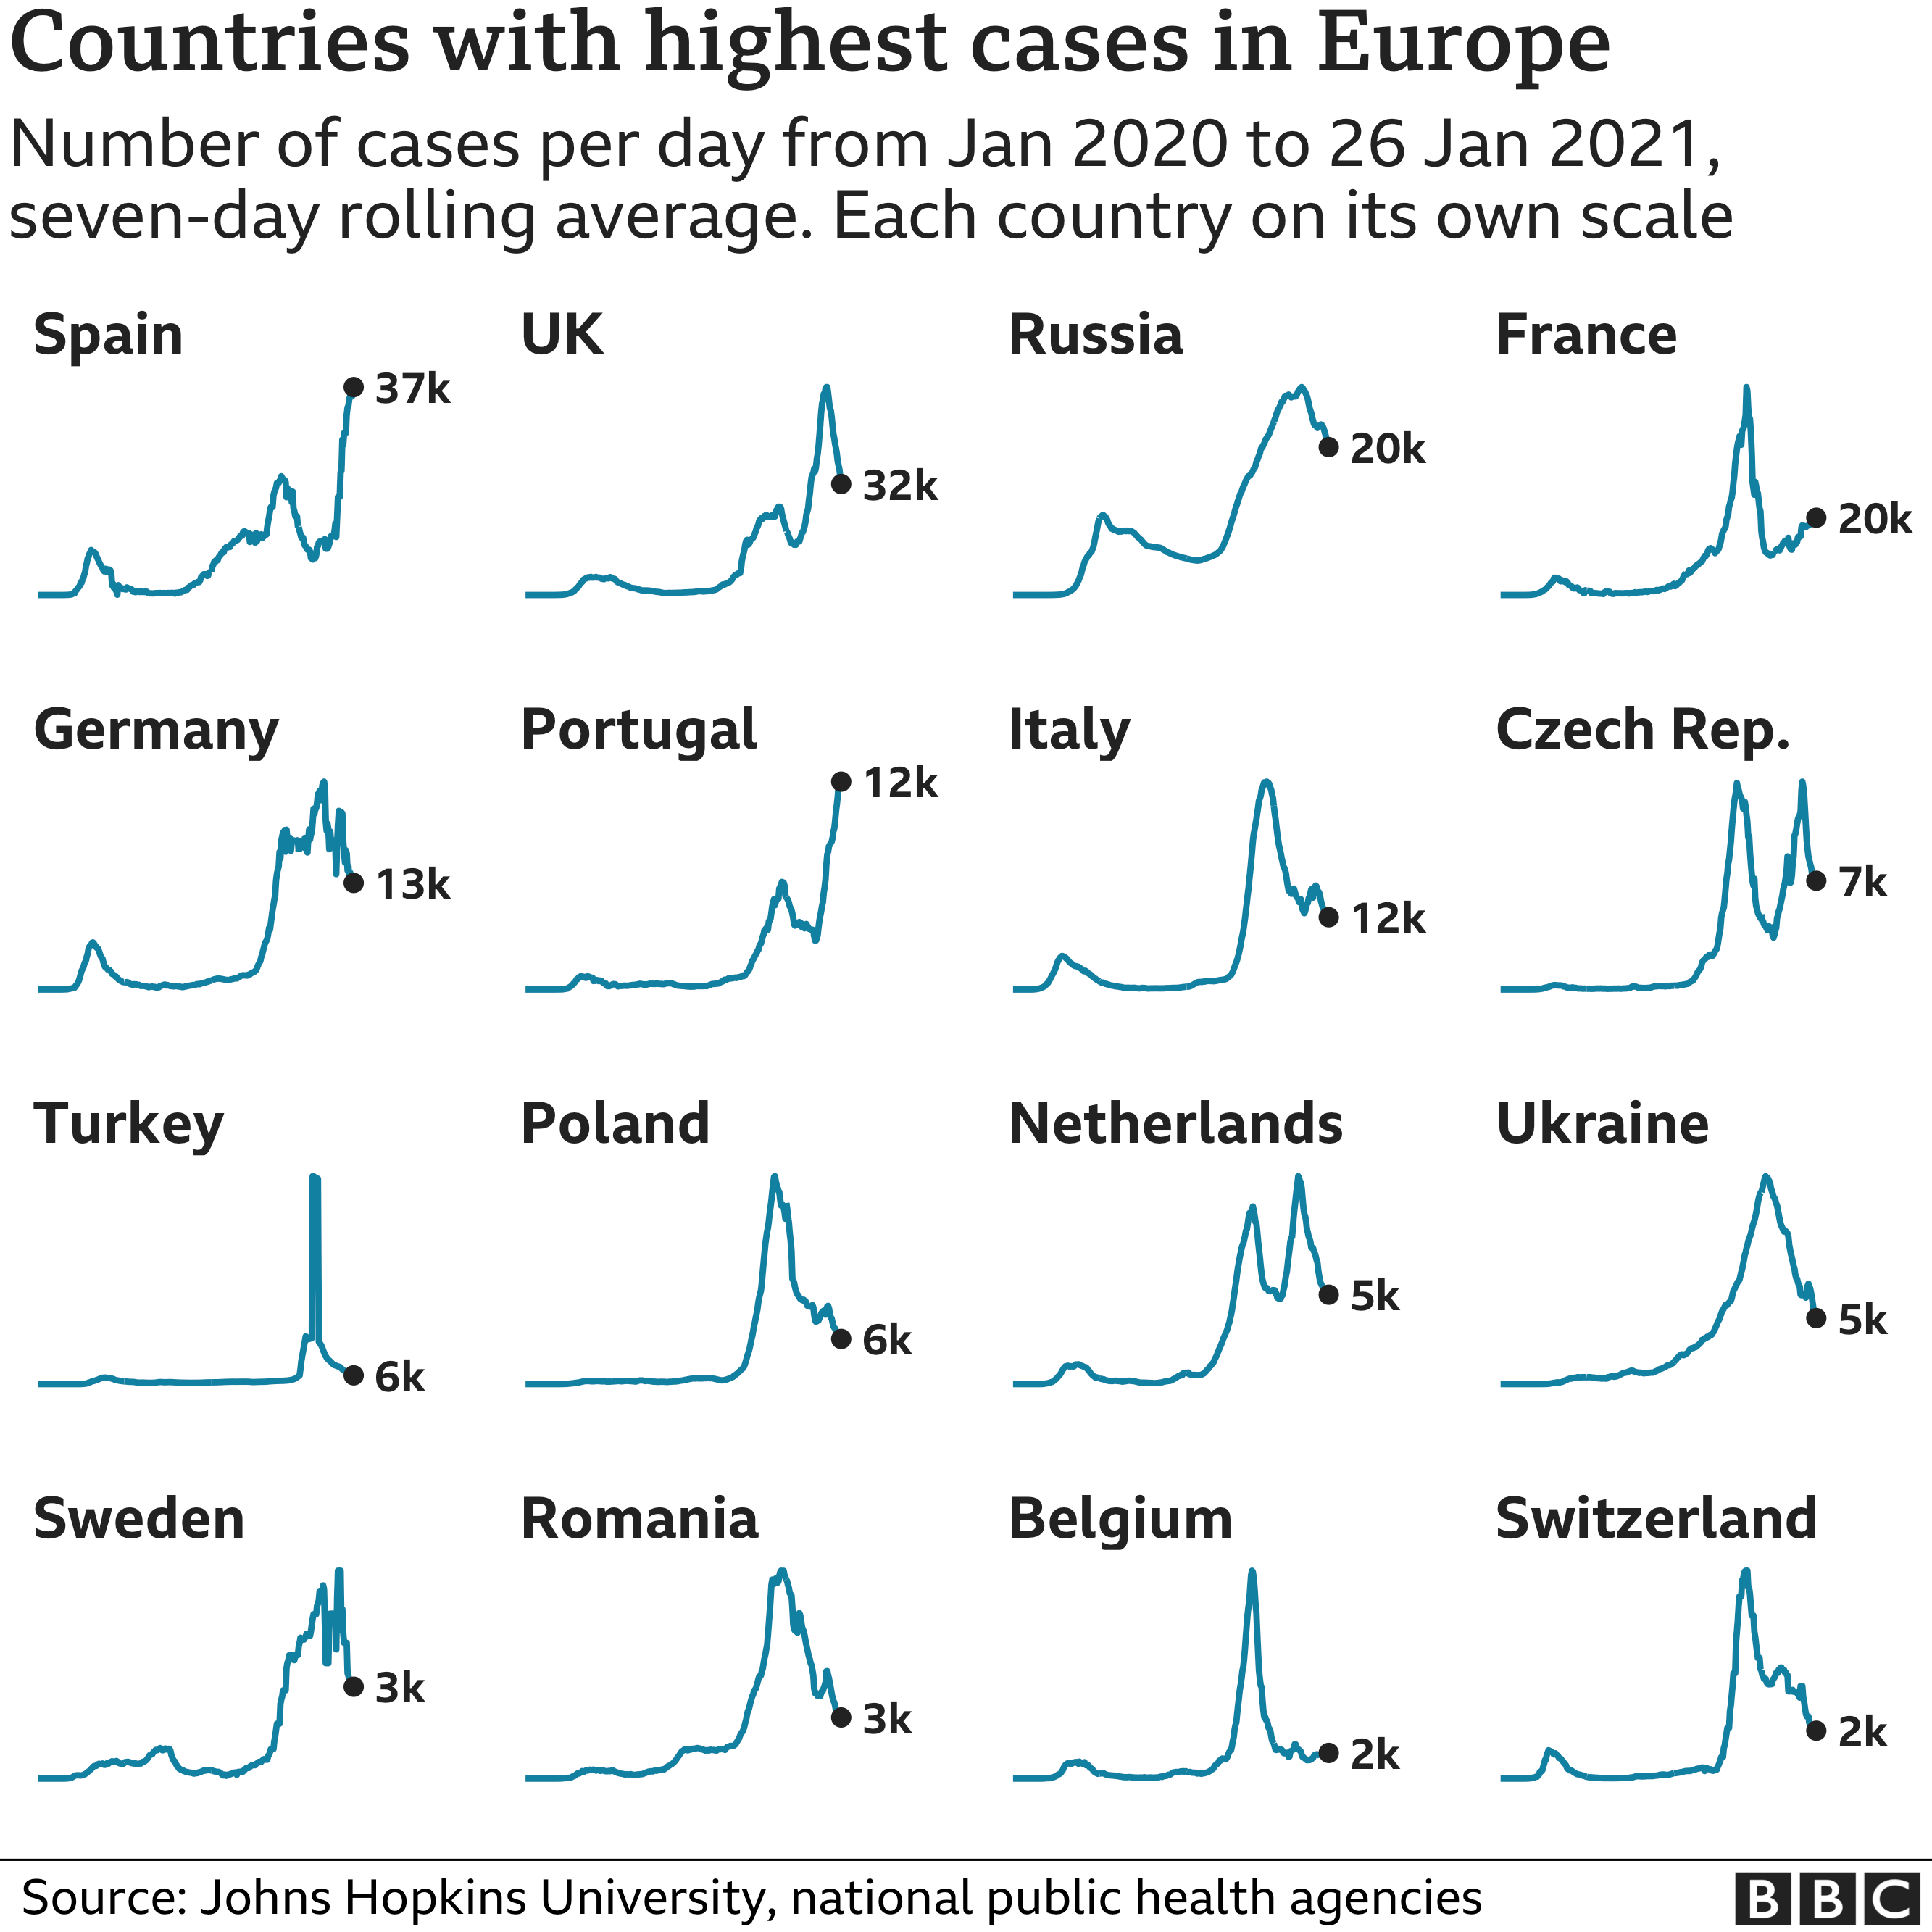
Europe
Many countries in Europe have seen coronavirus cases peak in recent weeks amid renewed surges of the virus.
The UK and Spain have seen the highest numbers, with Russia and France not far behind.
Lockdown restrictions were tightened in many of the worst-affected countries recently, leading to a drop in cases in some places.
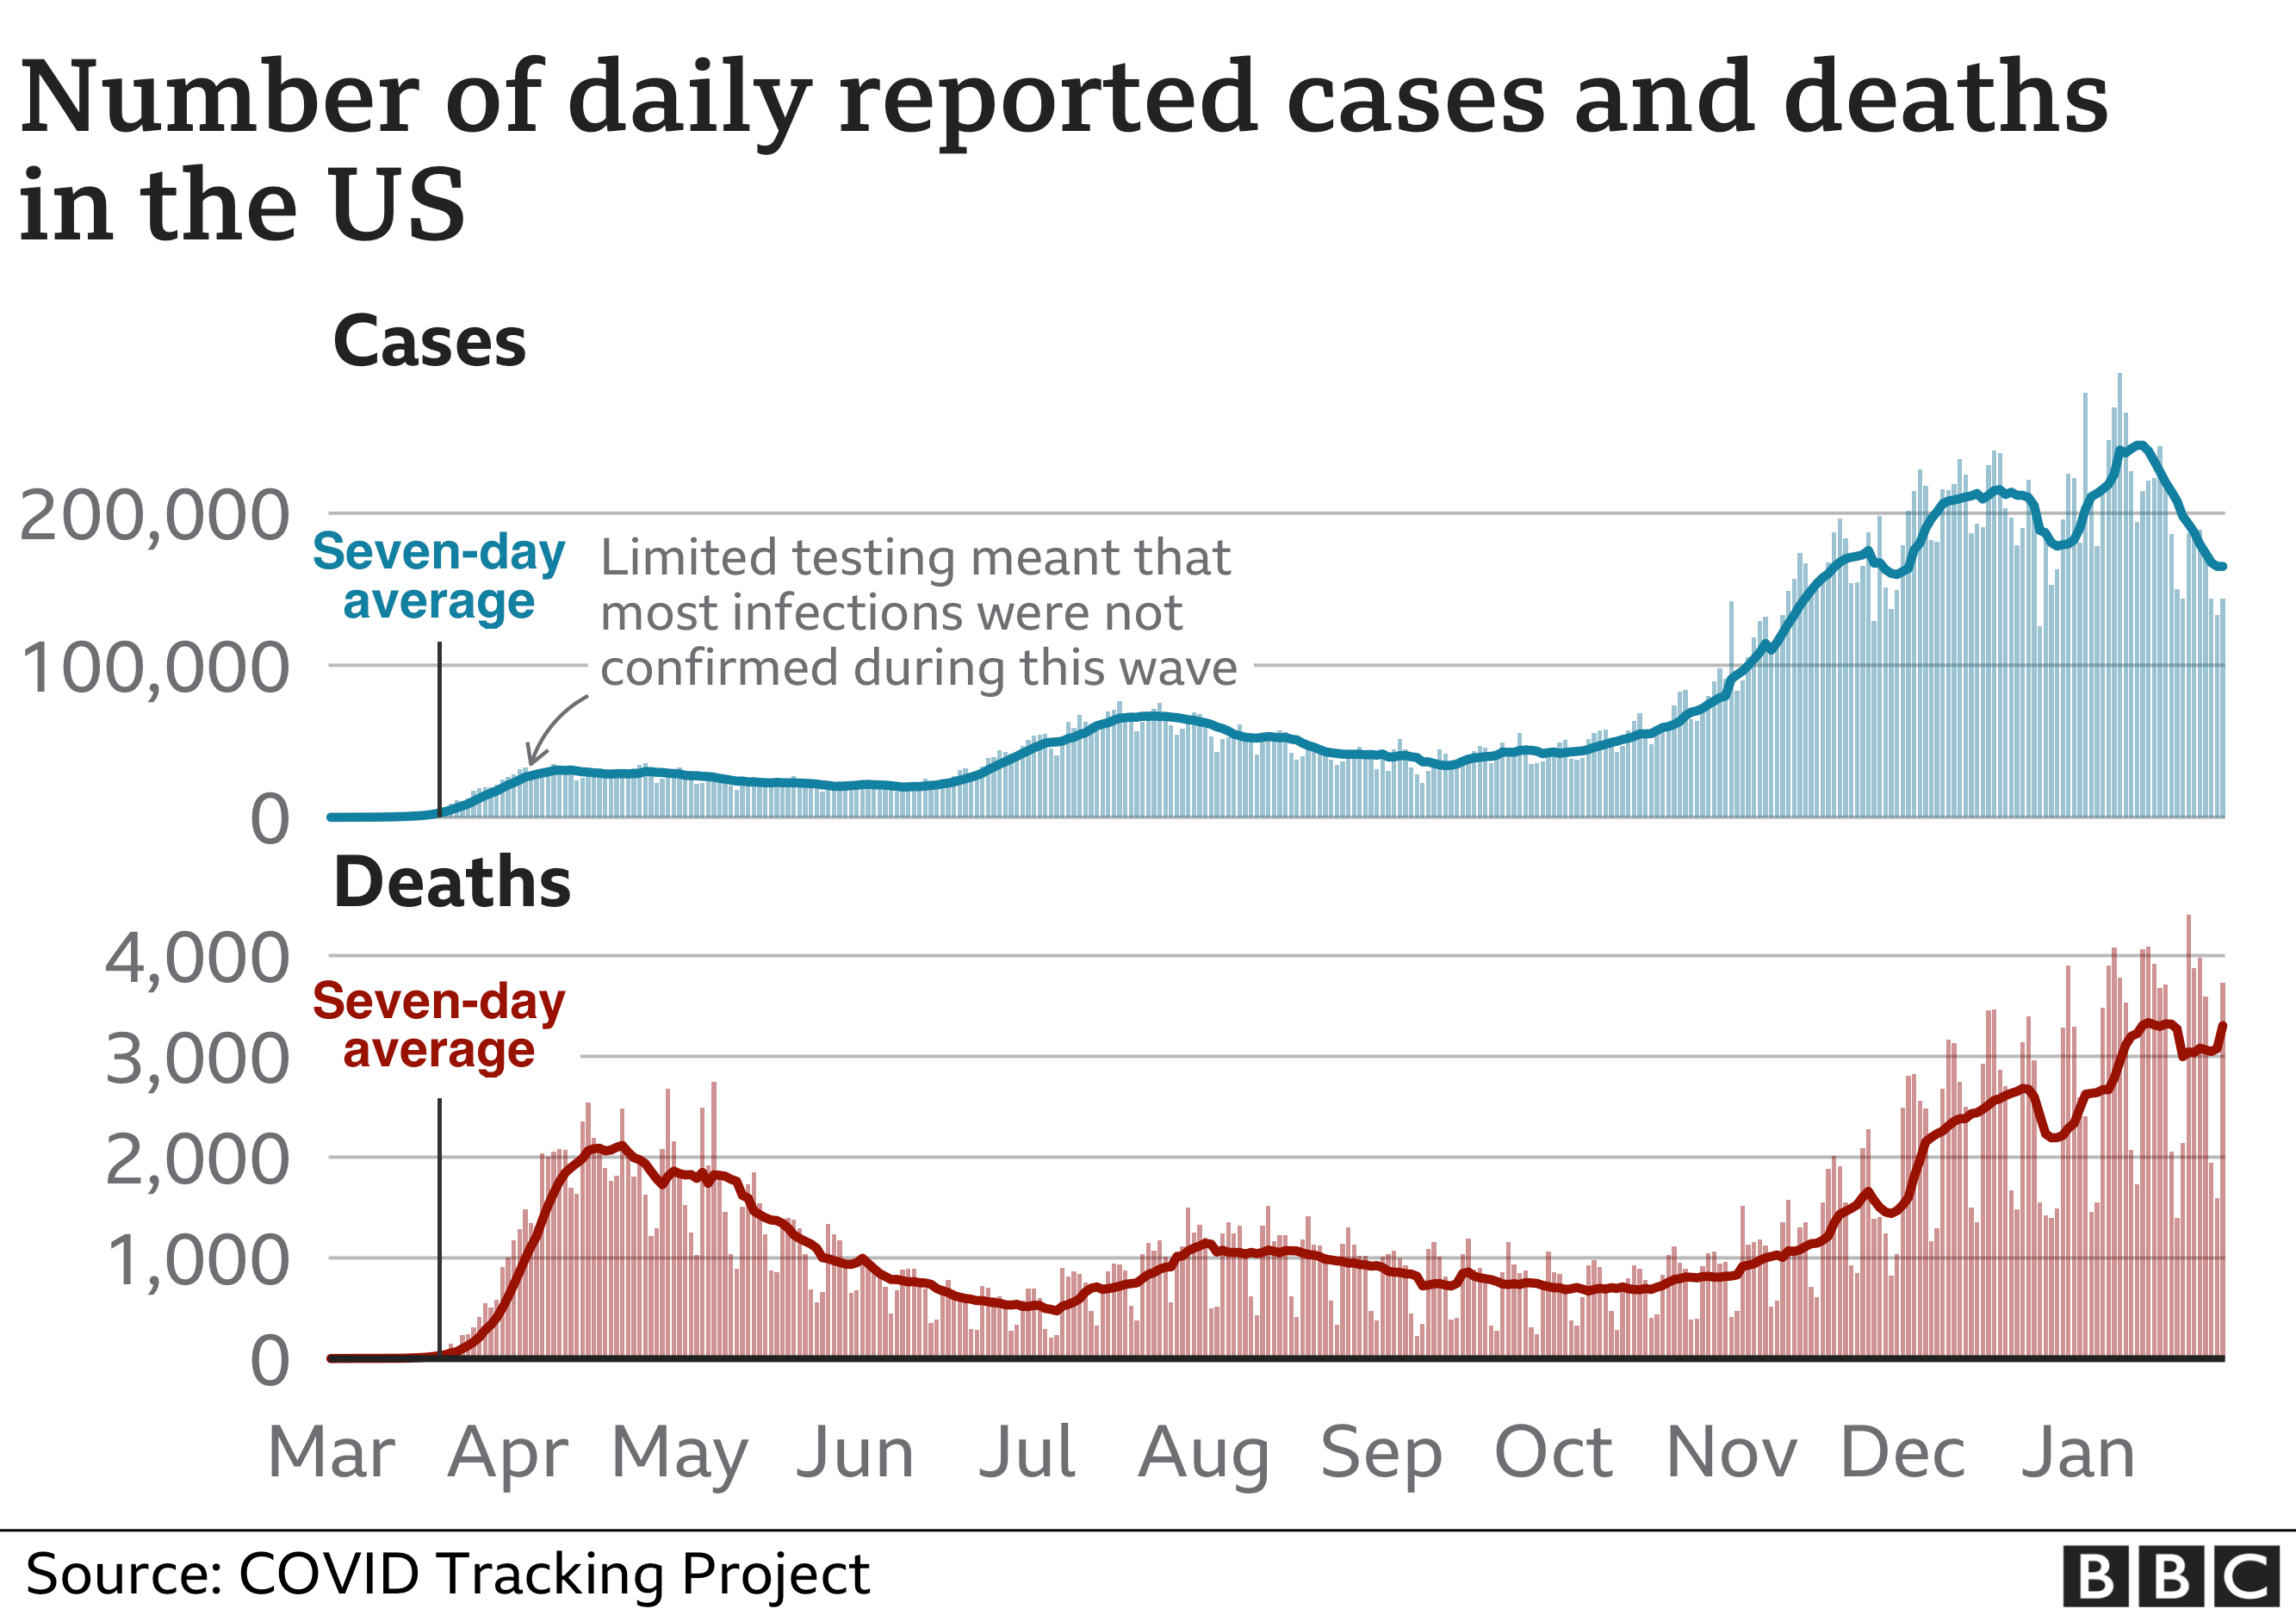
North America
The US has recorded about 25 million cases and more than 420,000 deaths, the highest figures in the world.
Daily cases were at record levels in early January but they are now falling. More than 100,000 coronavirus patients are in hospital, but those numbers are dropping too.
Canada, which has a far lower death rate than the US, also experienced a winter surge but daily cases are also falling there now.
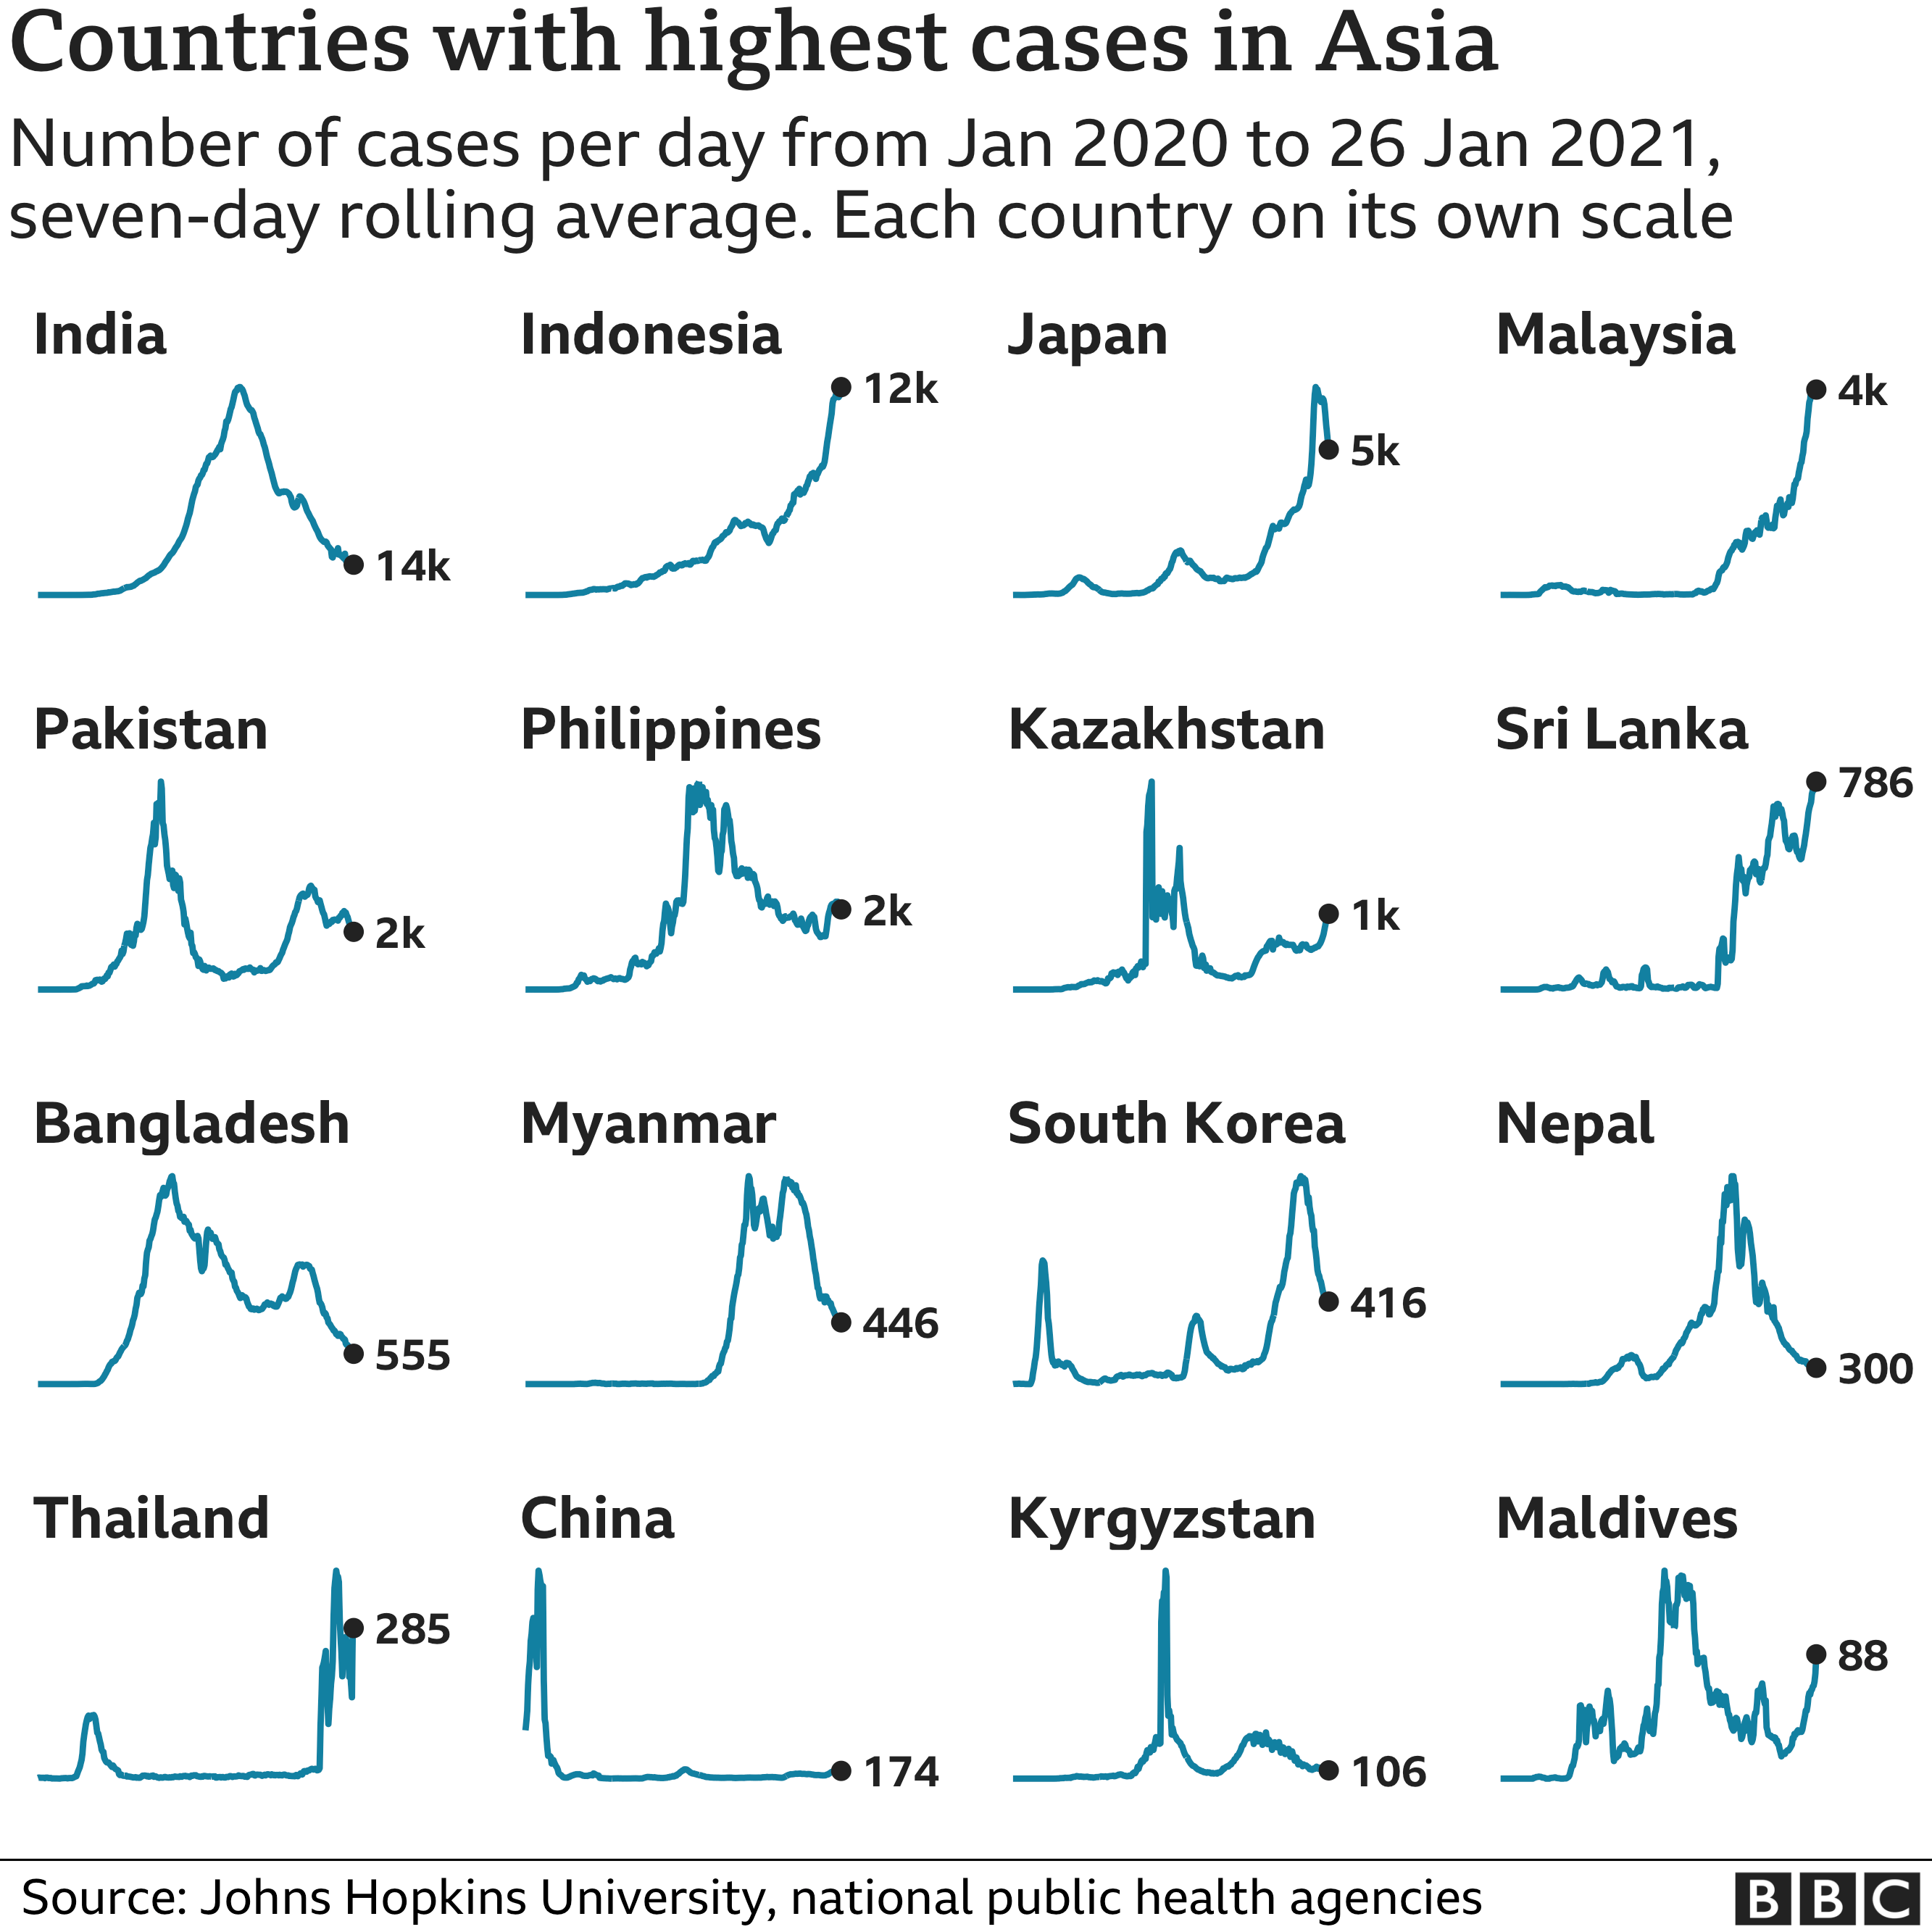
Asia
Asia was the centre of the initial outbreak that spread from China in early 2020, but the number of cases and deaths there has been lower than in Europe and North America.
The region saw a large rise in the number of cases last autumn, driven by a surge in infections in India, one of the most densely populated countries in the world.
India has seen more than 10 million confirmed cases, the second-highest in the world after the US, but the number of infections has fallen in recent months.
Other Asian countries, like Indonesia and Malaysia, are still trying to bring their current outbreaks under control.
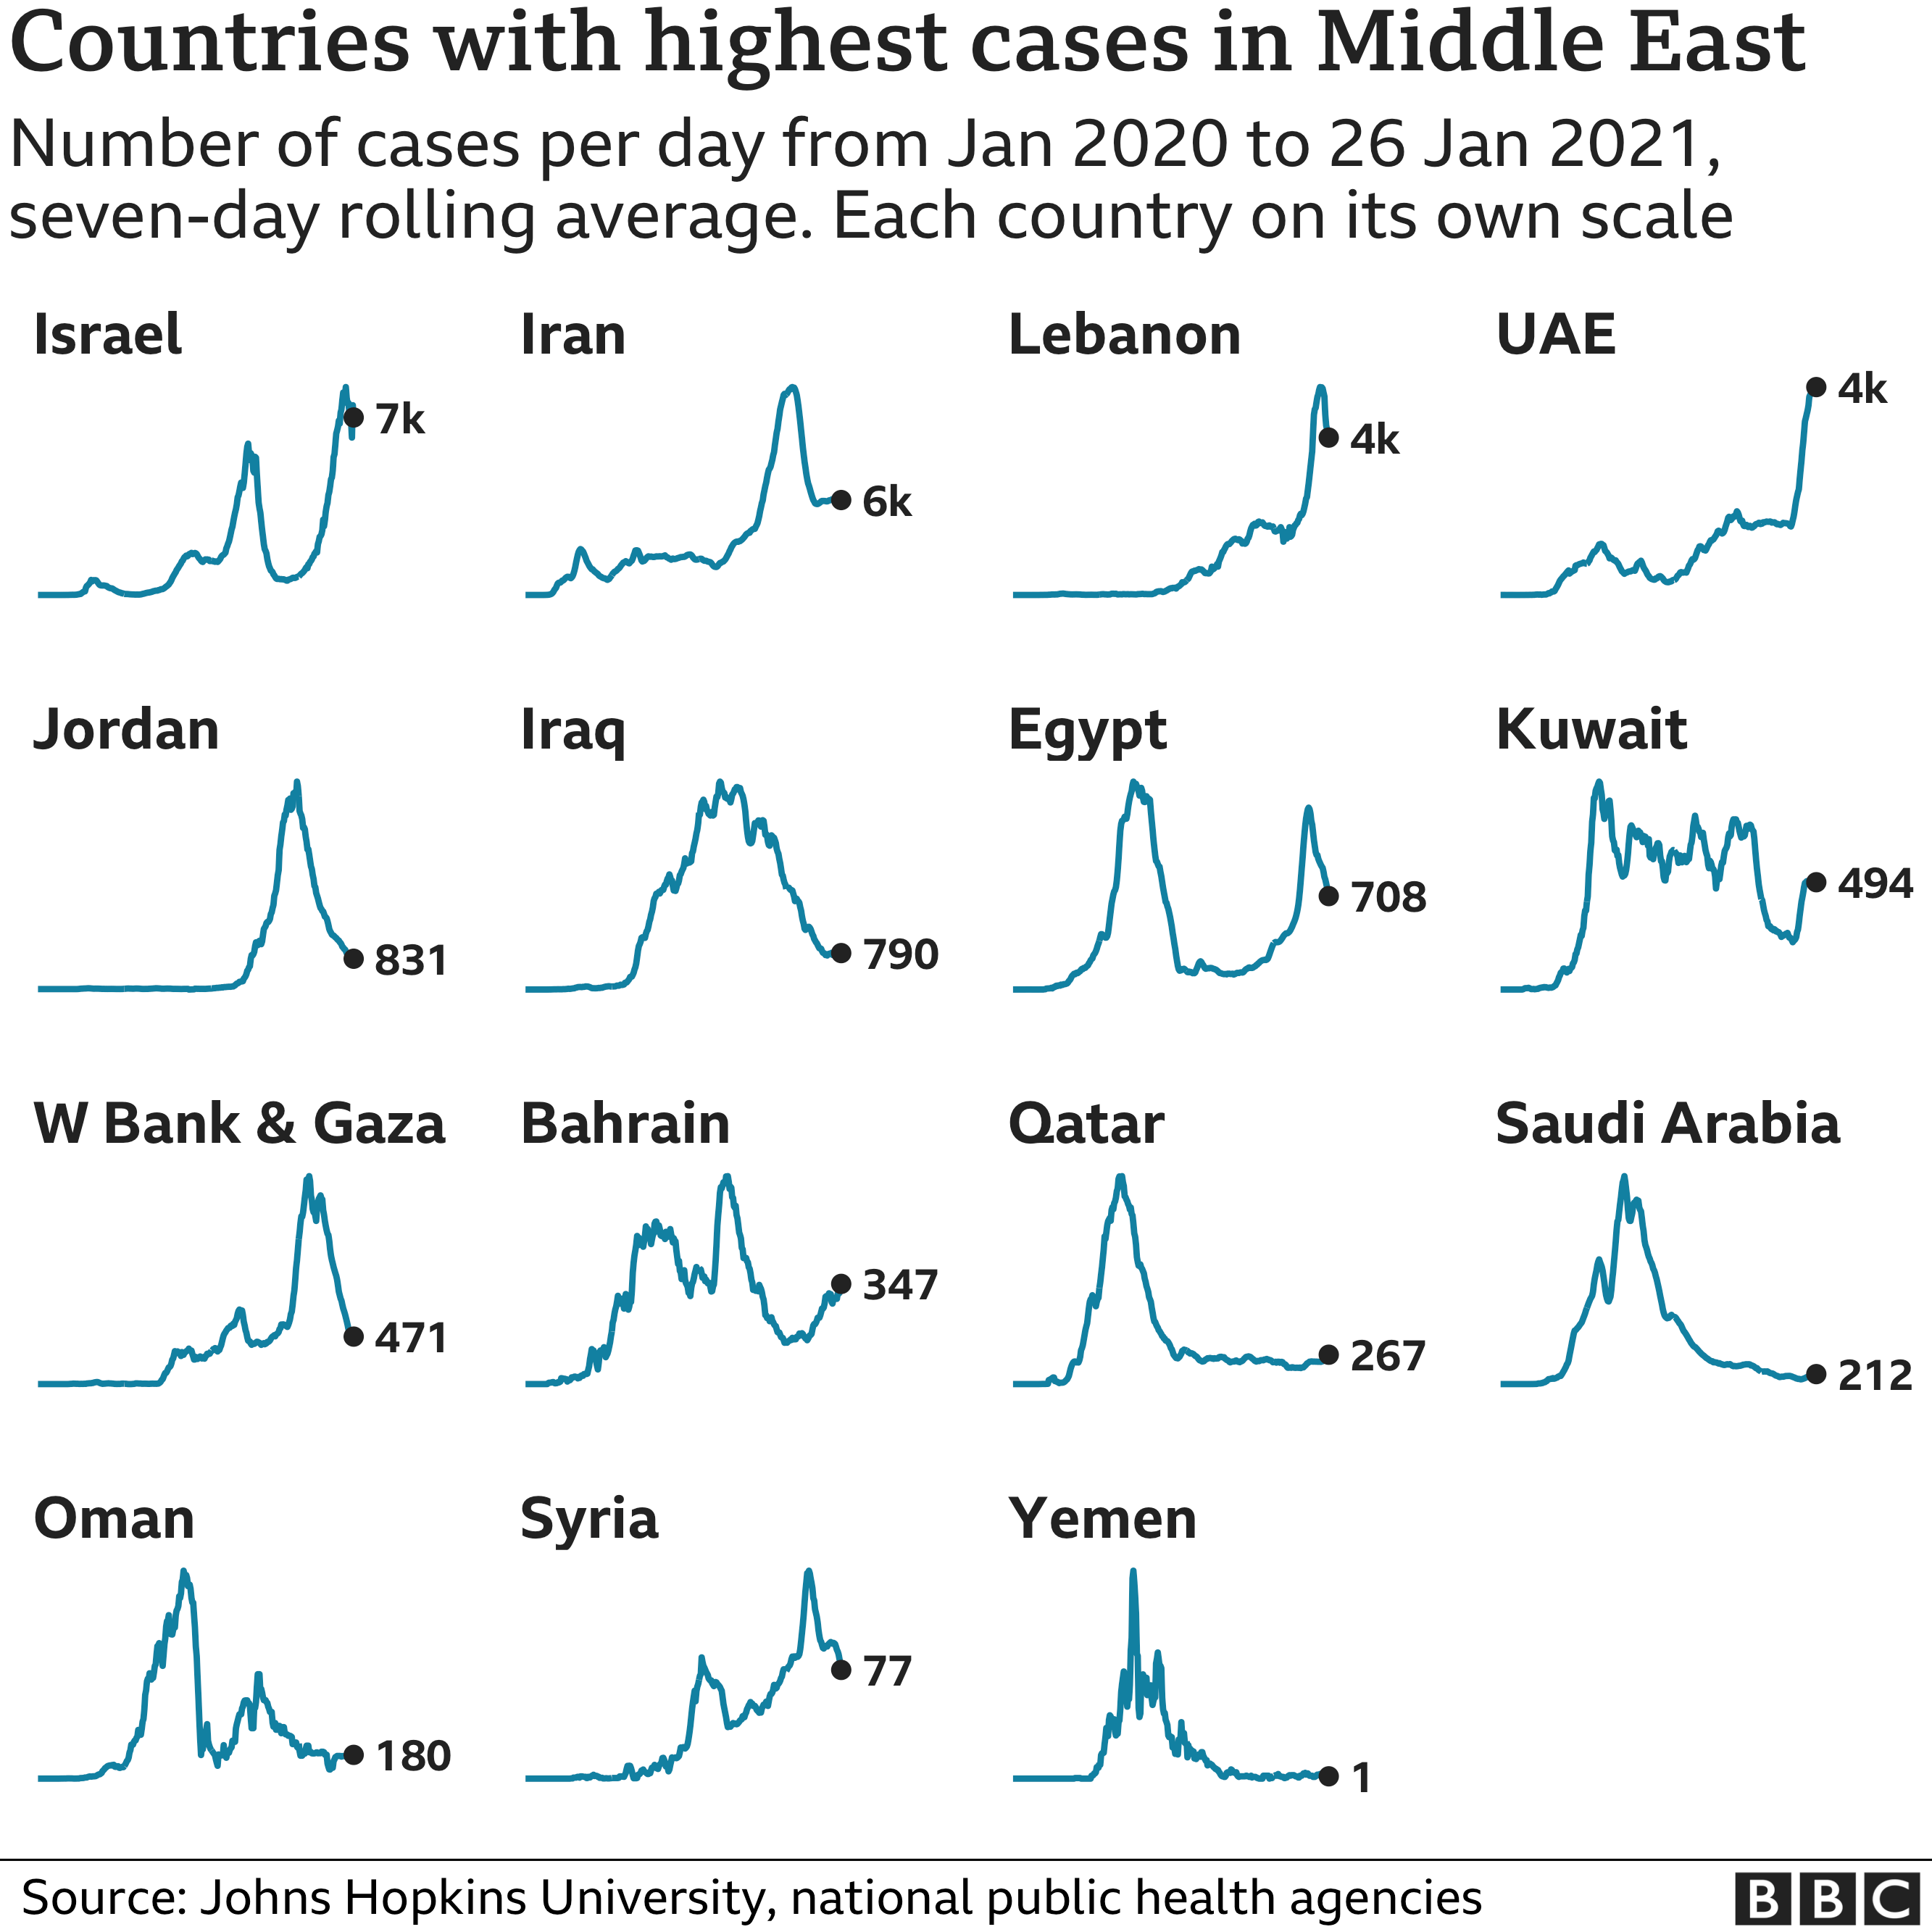
Middle East
Several countries in the Middle East have seen deadly coronavirus outbreaks over the past 12 months, with Iran, Iraq and Israel having seen the highest numbers.
All three countries appear to have now brought infections under control after recent surges – although the drop in cases has stalled in Iran.
Israel’s efforts have been helped by its vaccination programme, with nearly four million people in the country having now received a vaccine.
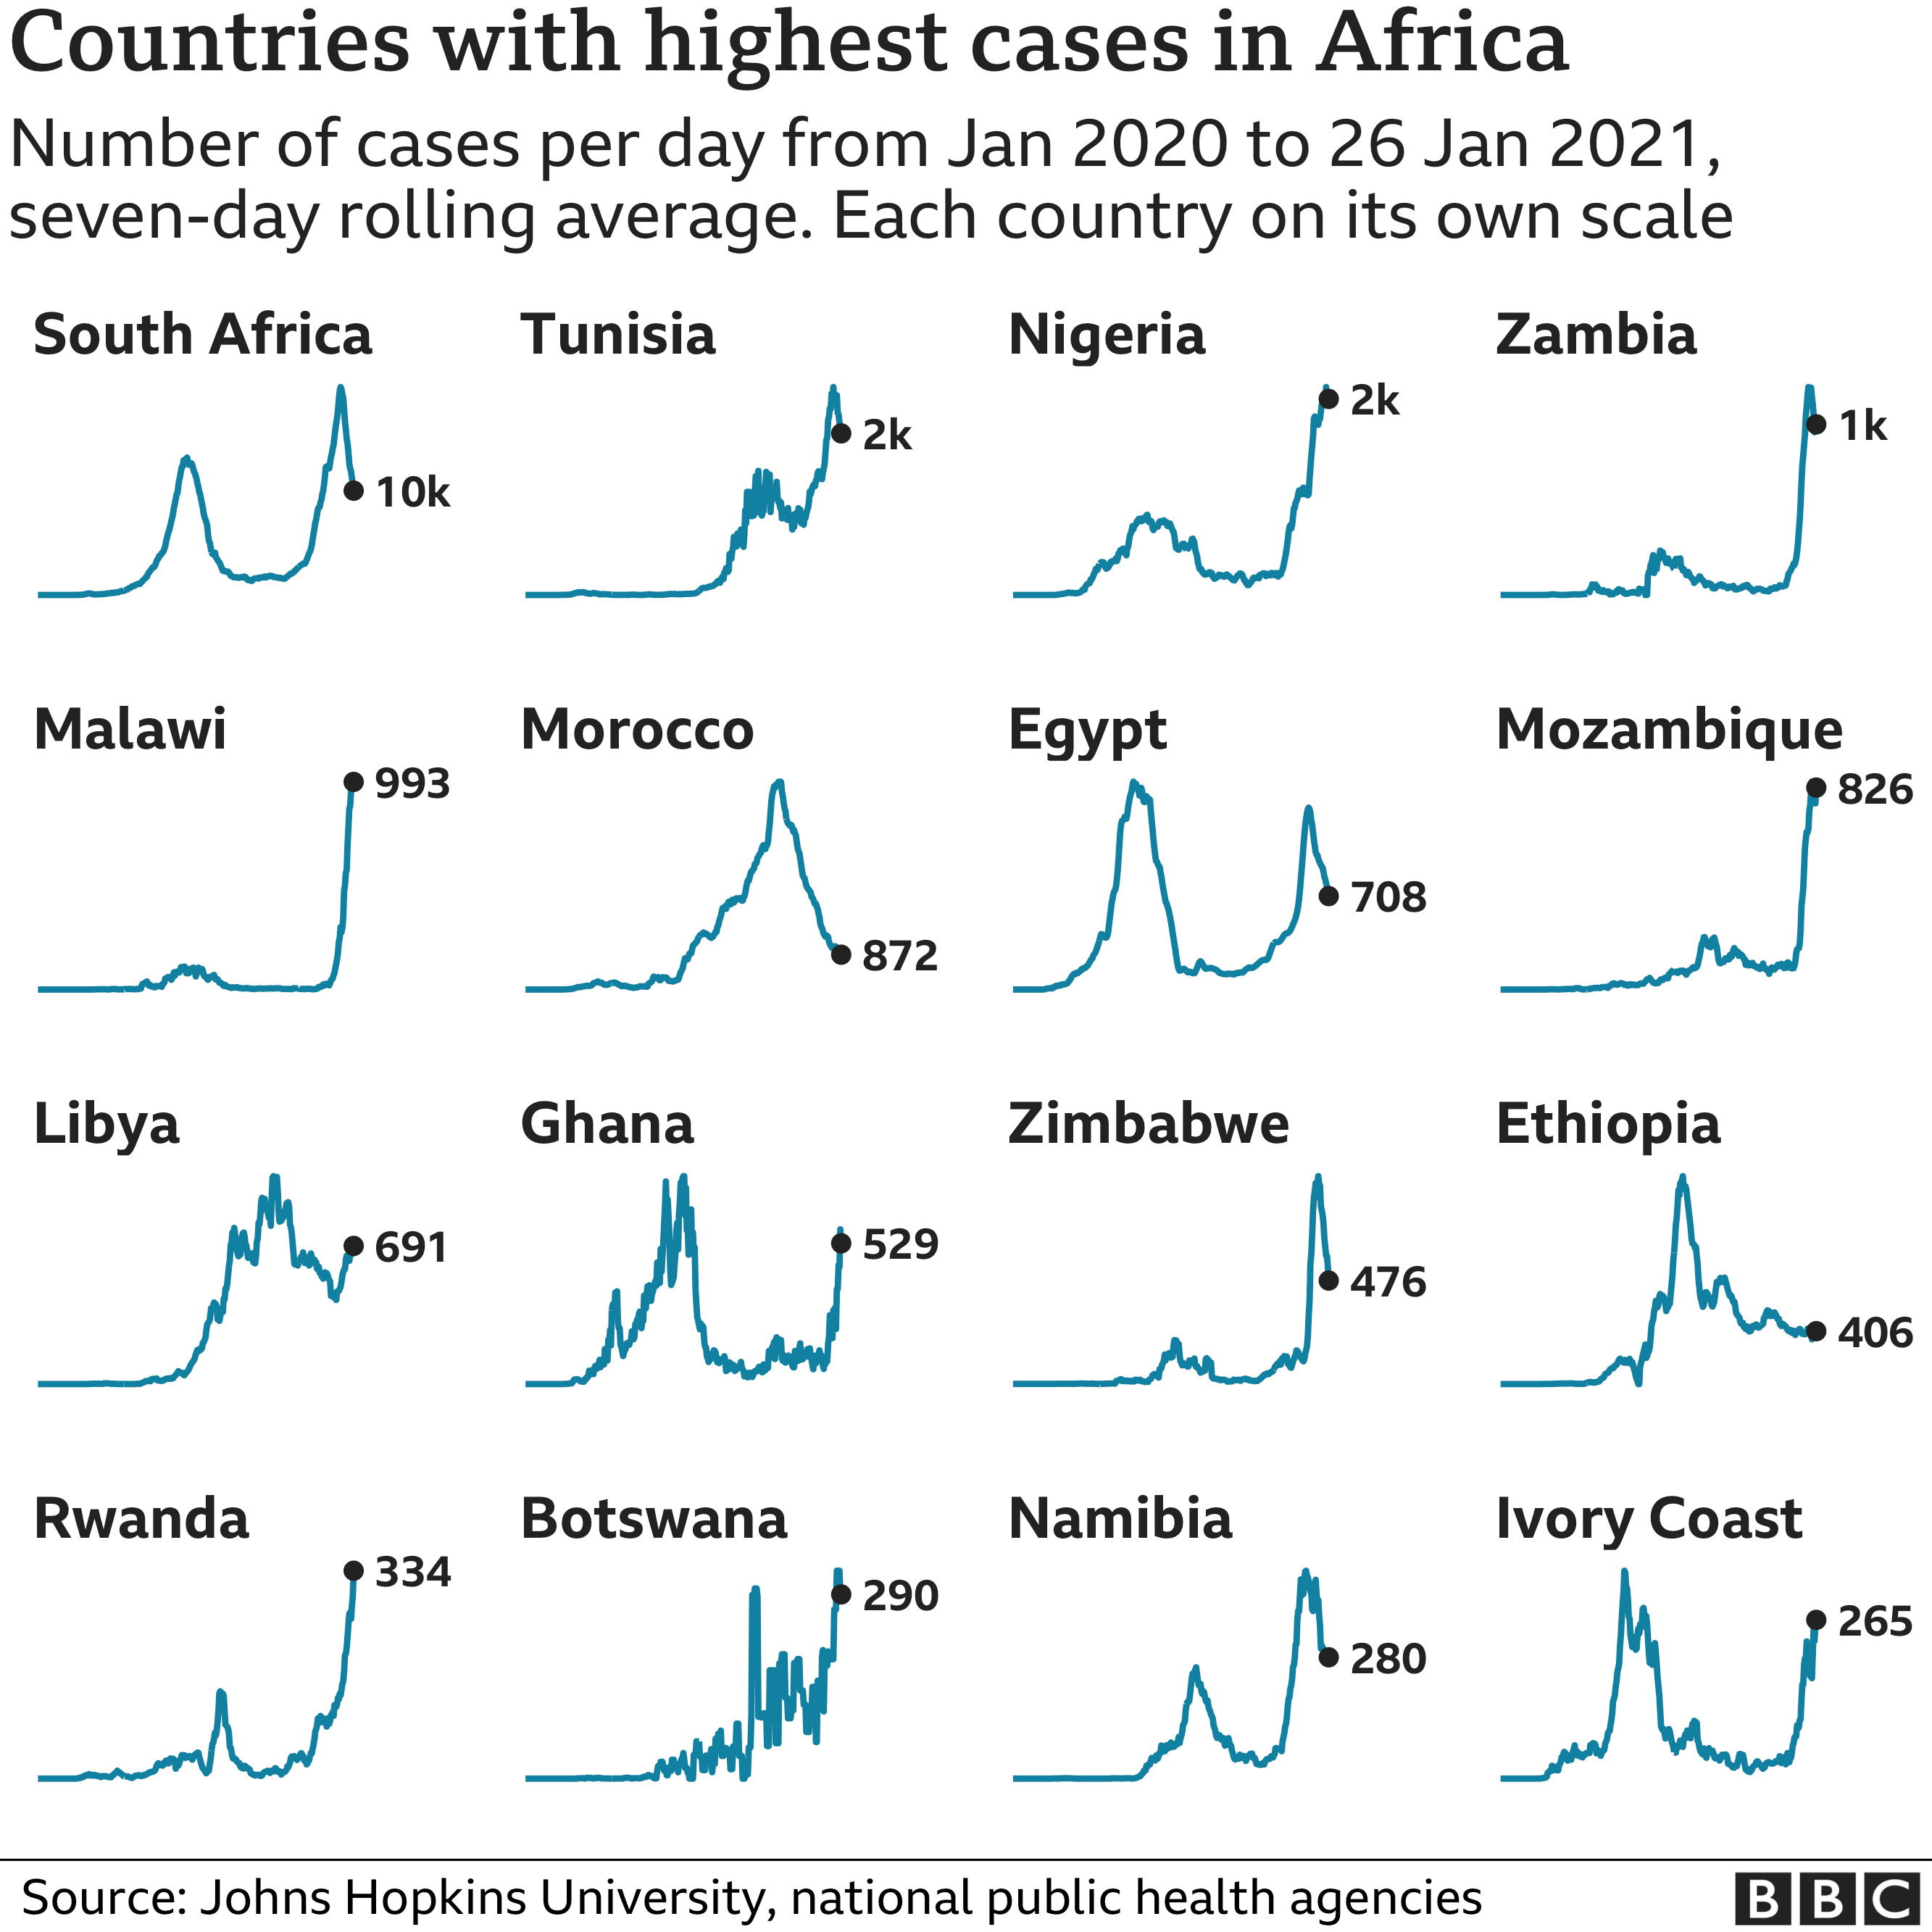
Africa
Africa has recorded about 3.5 million cases, but the true extent of the pandemic in many African countries is not known as testing rates are low.
South Africa, with more than 1.4 million cases and nearly 42,000 deaths, is the worst affected country on the continent, according to official figures.
Morocco, Egypt, Ethiopia, Tunisia, Libya, Algeria, Nigeria and Kenya are the only other African countries to have recorded more than 100,000 cases.
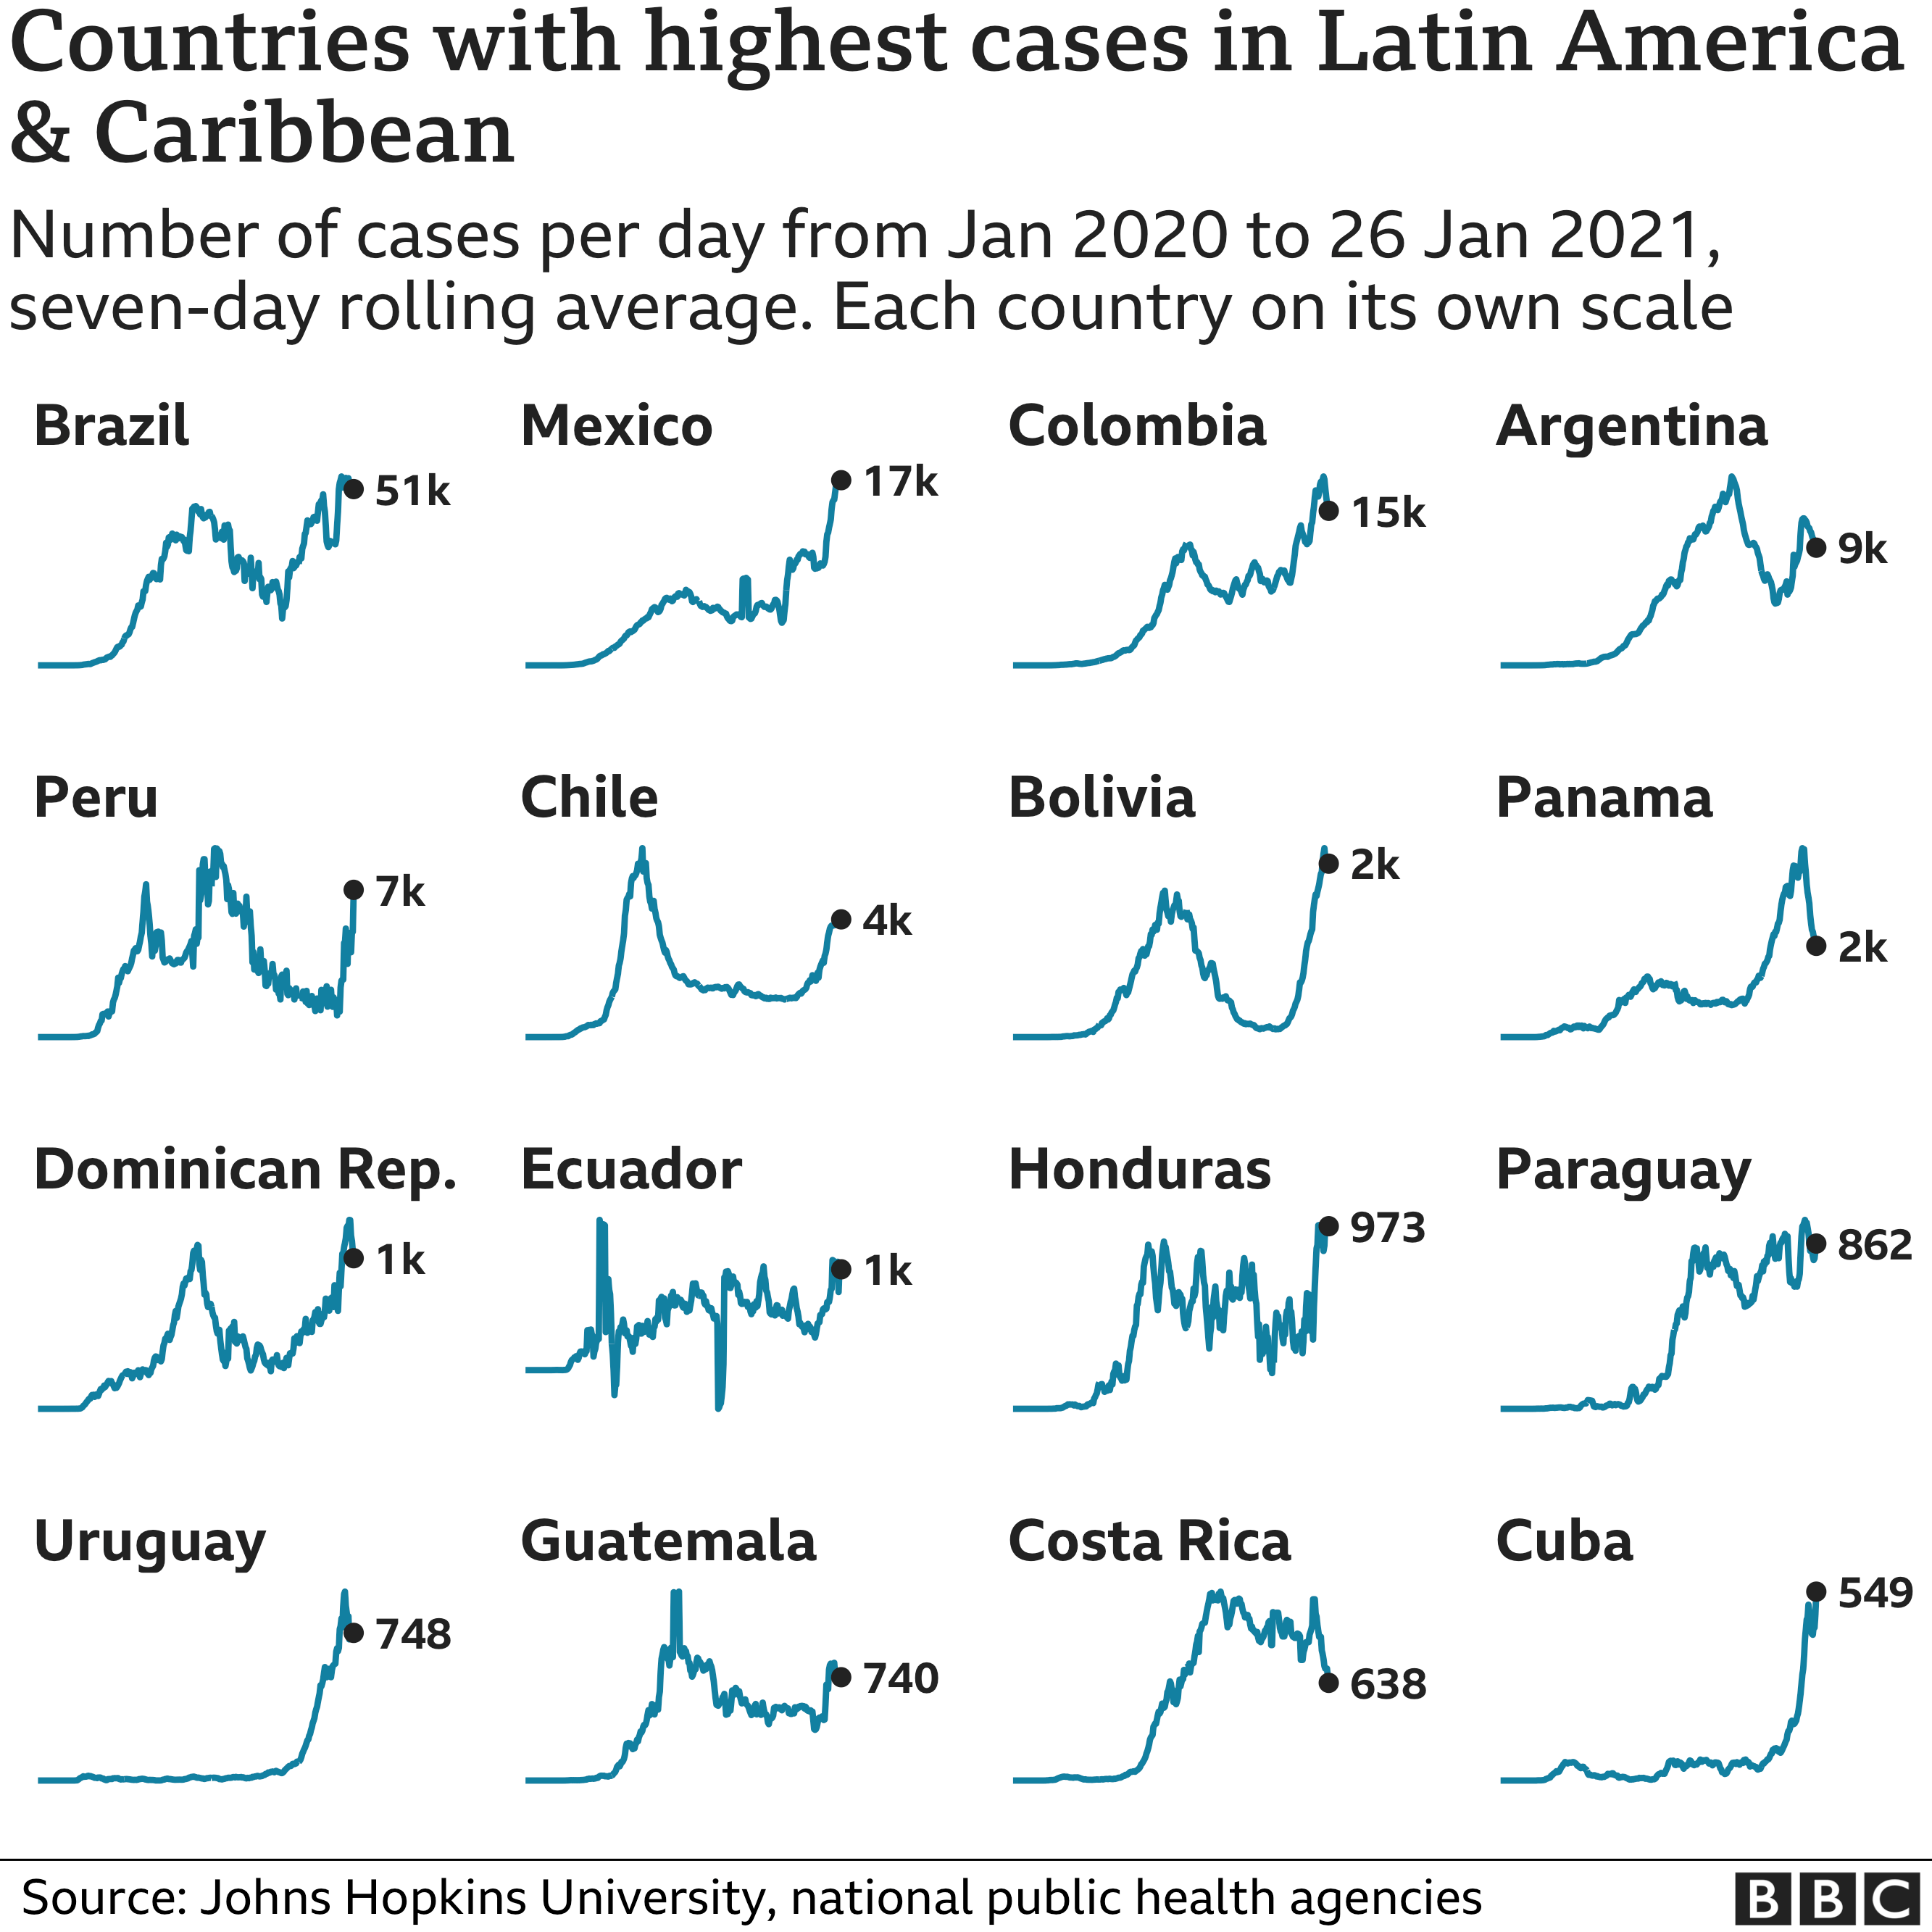
Latin America
In Latin America, there is concern about a new variant of the virus which is spreading rapidly in Brazil.
Brazil has nearly nine million confirmed cases and the world’s second highest death toll. It is currently in the middle of a second surge in infections.
Argentina, Colombia, Mexico and Peru have all recorded more than one million cases and continue to see high numbers of daily confirmed cases.
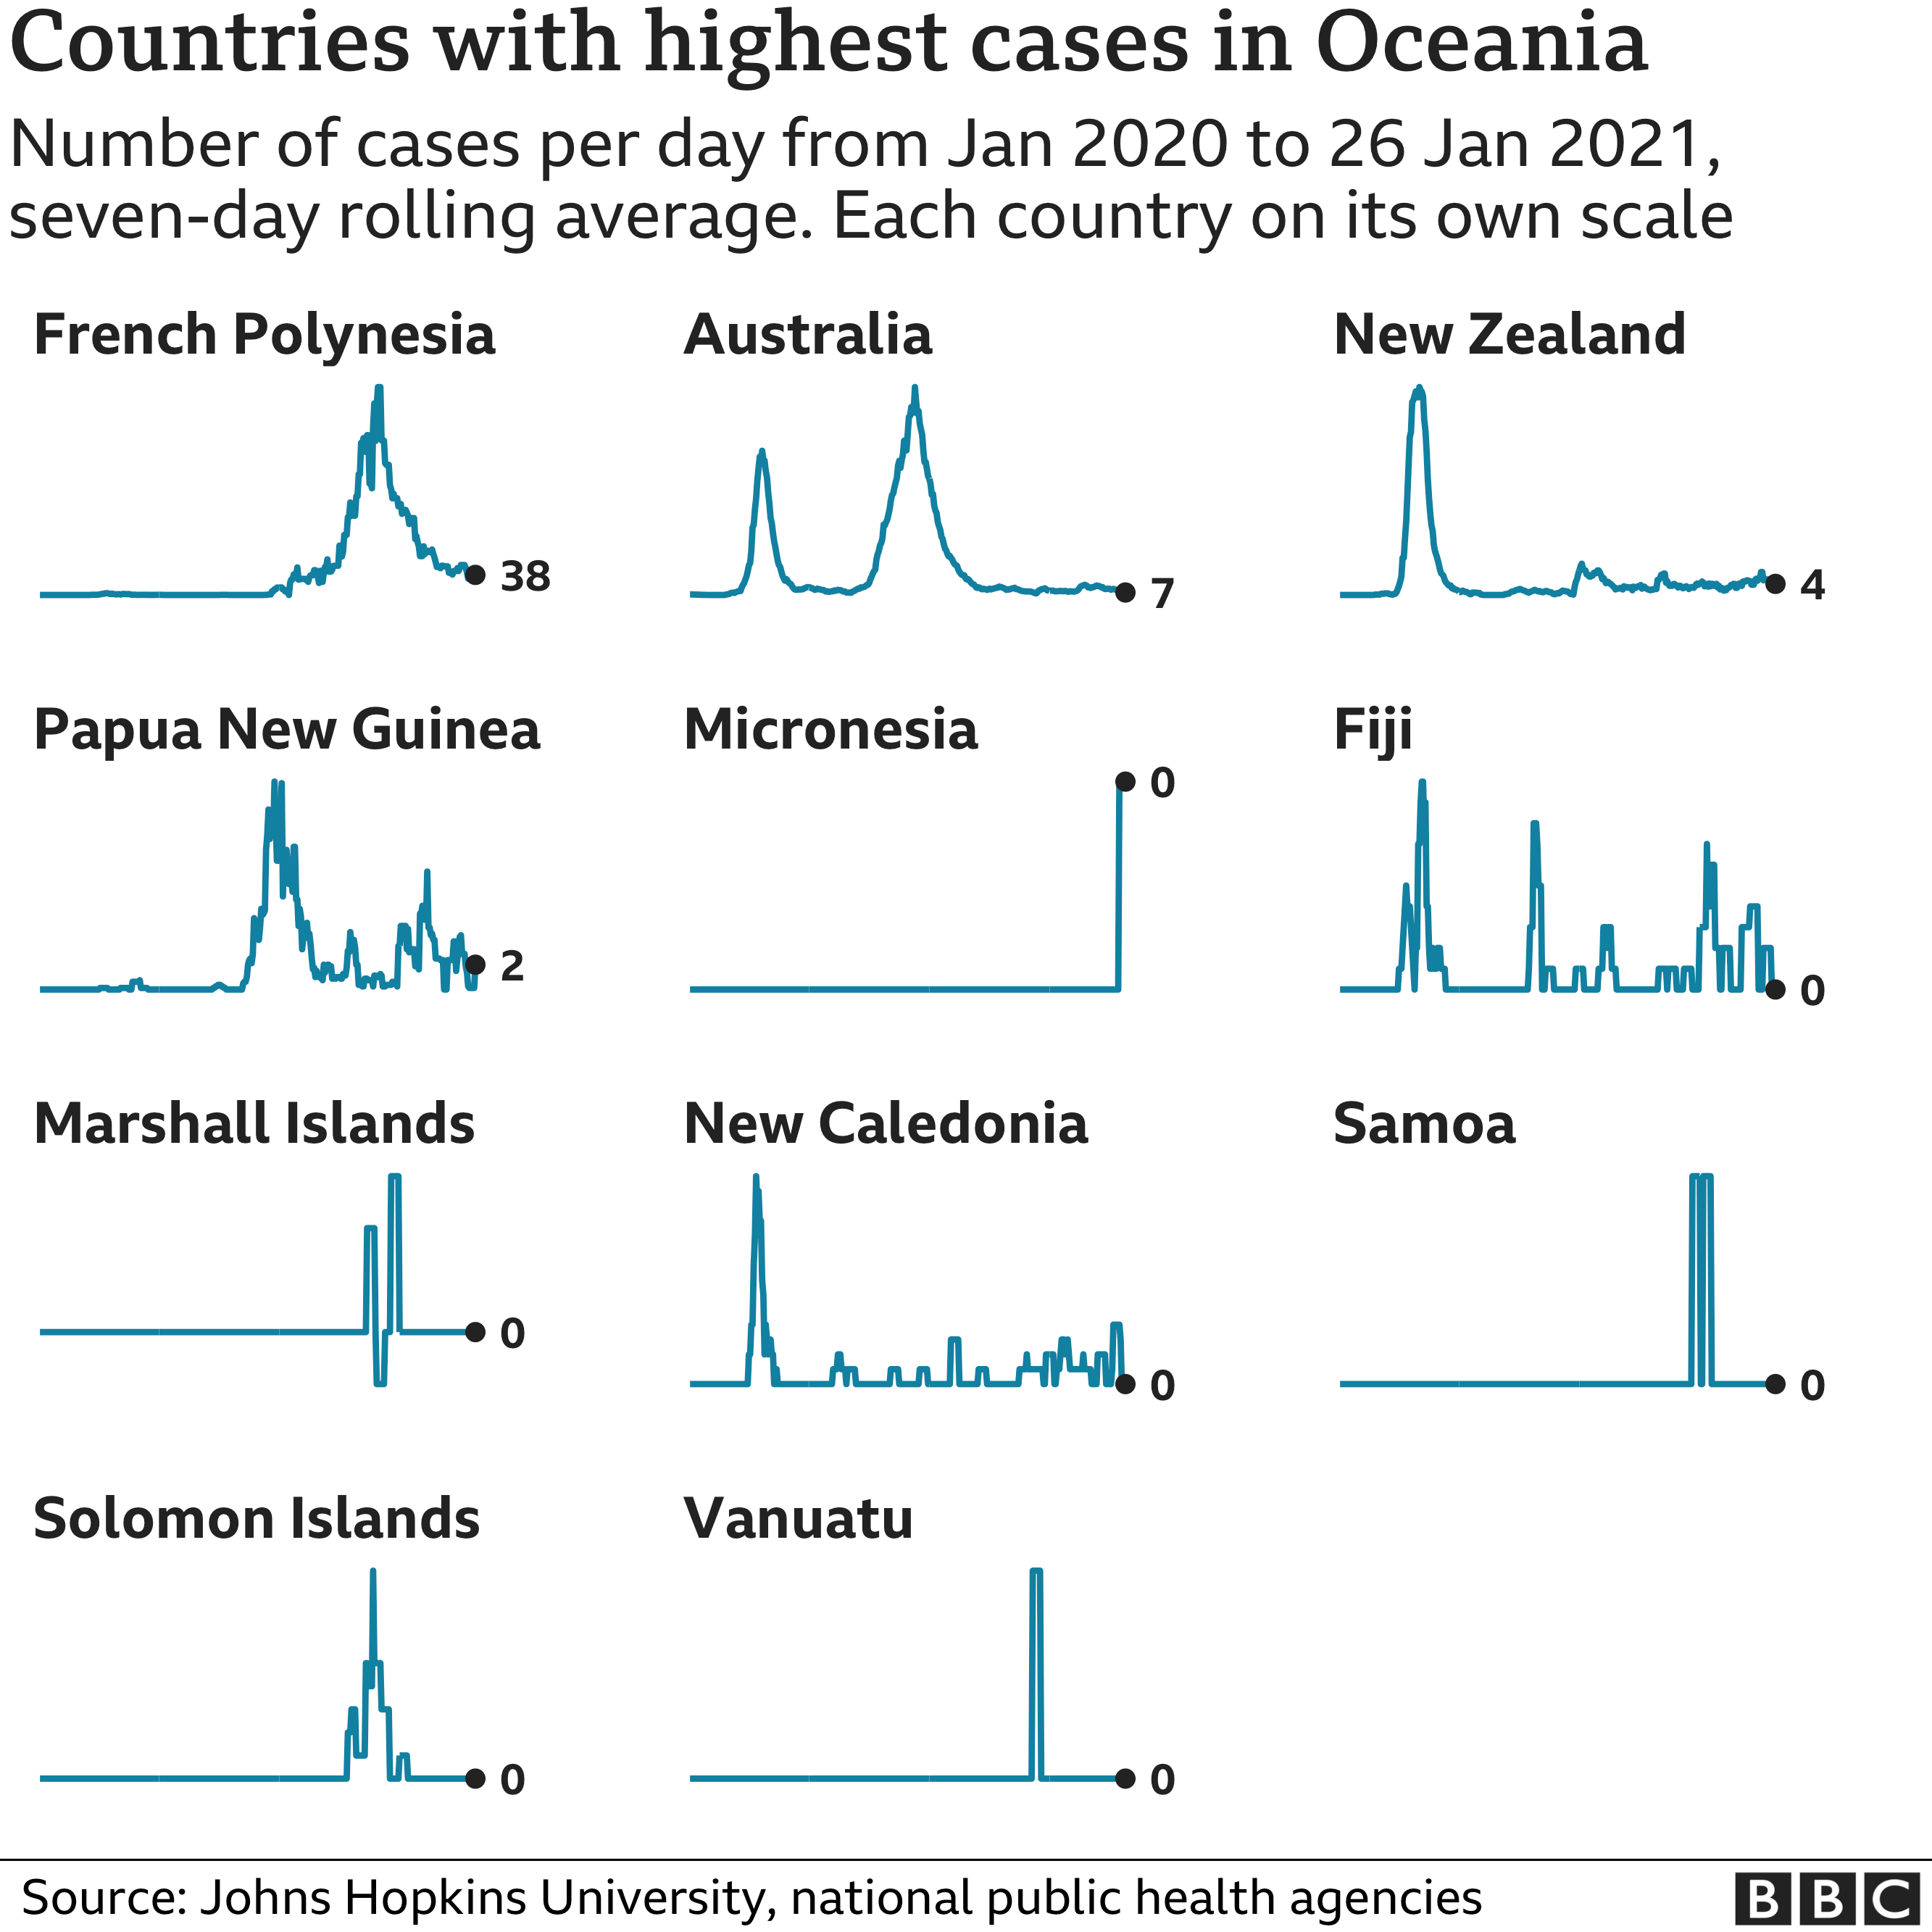
Oceania
Australia and New Zealand have been praised for their response to the pandemic, with both countries having seen comparatively few deaths.
In a sign of how effective their measures have been, both countries currently have a lower average number of cases than French Polynesia, a sprawling network of islands in the Pacific Ocean.
Other islands in the region have tried to remain free of coronavirus but most have seen at least a few cases.
How did coronavirus spread?
Covid-19 was first detected in the city of Wuhan, China, in late 2019 but the outbreak spread quickly across the globe in the first months of 2020.
It was declared a global pandemic by the WHO on 11 March 2020.
A pandemic is when an infectious disease is passing easily from person to person in many parts of the world at the same time.

- UK LOOK-UP: How many cases in your area?
- TESTING: What tests are available?
- SYMPTOMS: What are they and how to guard against them?
- VACCINE: How do I know the Covid vaccine is safe?

About this data
The data used on this page comes from a variety of sources. It includes figures collated by Johns Hopkins University, data from the European Centre for Disease Prevention and Control, national governments and health agencies, as well as UN data on populations.
When comparing figures from different countries it is important to bear in mind that not all governments are recording coronavirus cases and deaths in the same way. This makes like for like comparisons between countries difficult.
Other factors to consider include: different population sizes, the size of a country’s elderly population or whether a particular country has a large amount of its people living in densely-populated areas. In addition, countries may be in different stages of the pandemic.
souce:https://www.bbc.com/news/world-51235105